2,3,7,8-Tetrachlorodibenzo-p-dioxin (TCDD) affects the thyroid morphologically and/or functionally in adult animals. Recently, the National Toxicology Program conducted a 2-year gavage study of TCDD in female Harlan Sprague–Dawley rats. The only treatment-related alterations found in thyroid follicles were decreased luminal size and increased height of the follicular epithelial cells, without prominent protrusion into the lumen. The present study elucidated the nature of these follicular lesions. Thyroid glands of 10 rats each from the control, high (100 ng/kg/day)-dose, and stop-study (100 ng/kg/day, 30 weeks; vehicle to study termination) groups in the 2-year study were evaluated microscopically. Twenty randomly selected follicles were measured morphometrically in each animal. TCDD treatment significantly decreased the mean ratio of luminal/epithelial areas and increased the mean sectional epithelial height of the high-dose group compared to controls. Thyroid sections were immunostained with antibody against minichromosome maintenance (MCM) proteins, a novel cell-cycle biomarker. The MCM labeling index of the high-dose group was significantly higher than that of the control; however, the TUNEL labeling index was also higher in the high-dose group than the control. All data from the stop group were comparable to those from controls. These results indicate that the follicular cell response was hypertrophic and reversible. This information should contribute to diagnosis of nonneoplastic thyroid follicular lesions in rats.
Keywords: Thyroid; follicular epithelial cells; hypertrophy; dioxin; TCDD; morphometry
INTRODUCTION
The International Agency for Research on Cancer (IARC) has concluded that 2,3,7,8-tetrachlorodibenzo-p-dioxin (TCDD) is a human carcinogen (IARC group 1 classification) (International Agency for Research on Cancer, 1997). This conclusion was based on evidence of increased incidence of cancer observed in follow-up studies of industrial workers accidentally exposed to large amounts or constantly exposed to trace amounts over a long period of time (Becher et al., 1996; Fingerhut et al., 1991; Ott and Zober, 1996; Saracci et al., 1991). Sufficient evidence of carcinogenicity in experimental animals (Della Porta et al., 1987; Kociba et al., 1978; National Toxicology Program, 1982a, 1982b; Rao et al., 1988) supported that conclusion (International Agency for Research on Cancer, 1997).
Exposure to TCDD has been shown to affect the thyroid morphologically and/or functionally in adult animals (Gorski and Rozman, 1987; Henry and Gasiewicz, 1987; National Toxicology Program, 1982a; Potter et al., 1983). Chronic gavage administration of TCDD (average daily equivalent doses: 10–500 ng/kg/day) caused increased incidence of thyroid follicular cell adenomas of Osborne-Mendel rats (National Toxicology Program, 1982a). Speculation that TCDD is a thyroid carcinogen was derived from results obtained from female Sprague–Dawley (SD) rats treated with TCDD (average daily equivalent doses: 0.1–125 ng/kg/day) for 30 weeks (Sewall et al., 1995). Other data indicated, however, that no increased incidence of thyroid follicular cell adenomas occurred in SD rats treated with TCDD-containing (1–100 ng/kg/day) diet for 2 years (Kociba et al., 1978).
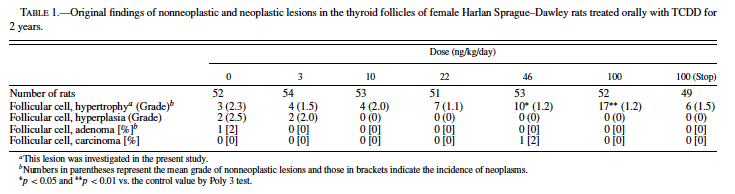
TCDD is the most toxic compound in the chemical class of the polyhalogenated aromatic hydrocarbons (PHAHs) that always exist in the environment as complex mixtures; thus, exposure to PHAHs occurs as exposure to a complex mixture. To simplify assessment of the complicated risks of exposure to these PHAH mixtures, the concept of the Toxic Equivalence Factors (TEFs)1 has been developed (Ahlborg et al., 1992; Barnes, 1991). Recently, as part of an initiative to evaluate the TEFs for the carcinogenicity of dioxins, the National Toxicology Program (NTP) conducted another 2-year carcinogenicity study in female Harlan SD rats (National Toxicology Program, 2004). (The design of the study is described under Methods.) In that study, although serum thyroxine (T4) levels decreased and thyroid stimulating hormone (TSH) levels increased in the interim examinations, no dose-dependent increase in the incidence of thyroid neoplastic lesions occurred (Table 1). Instead, there were treatment-related nonneoplastic changes consisting of smaller follicles with narrower luminal spaces and higher lining epithelial cells compared with normal thyroid morphology. These changes were first diagnosed as follicular atrophy, probably due to shrinkage of follicles. The Pathology Working Group (PWG) of the NTP has reviewed the histopathologic changes and proposed that these lesions be diagnosed as hypertrophy. No quantitative evidence is available to support whether these lesions should be categorized as hypertrophy, atrophy, or hyperplasia.
Hypothesizing therefore that the response might be hypertrophic and attempting to resolve this issue, we conducted this retrospective study using morphometric analysis and immunohistochemical techniques. The size of thyroid follicles was measured morphometrically to determine whether TCDD induced hypertrophy of the epithelium and increased the ratio of epithelial area to follicular luminal area. To analyze any possible increase in the number of follicular epithelial cells, proliferative activities of these cells were examined immunohistochemically. As a biomarker of proliferation of follicular epithelial cells, immunolocalization of minichromosome maintenance (MCM) proteins was used. MCM proteins are indispensable to DNA replication in all eukaryotic cells (Chong et al., 1995; Kubota et al., 1995; Madine et al., 1995), and their recent localization has facilitated identification of cellular proliferation and tumor diagnosis and/or prognosis in human pathology (Alison et al., 2002; Freeman et al., 1999; Kodani et al., 2001; Rodins et al., 2002); however, their application as a cellular proliferation indicator in rodents has been limited.
Although TCDD is thought to be a multi-organ carcinogen, the compound is believed to be nongenotoxic (Fahrig, 1993; Geiger and Neal, 1981). In the recent NTP investigation of TCDD (National Toxicology Program, 2004), groups of rats treated with the highest dose of TCDD for 30 weeks and 30 weeks plus vehicle until the termination of the study (stop group) were examined to test the hypothesis that a relatively shorter period of TCDD treatment cannot promote tumorigenesis. In the present study, we went a step further to determine morphometrically whether the lesions observed in the thyroid of the stop group were reversible.
The purpose of the present retrospective study, therefore, was to characterize and evaluate treatment-induced changes in the thyroid gland of rats chronically exposed to TCDD and those that received a 30-week exposure and were held until 2 years without further TCDD treatment.
MATERIALS AND METHODS
Chemicals: 2,3,7,8-Tetrachlorodibenzo-p-dioxin (TCDD, CR82-2-2, purity approx. 98%) was supplied by IIT Research Institute (Chicago, IL). Acetone and corn oil were obtained from Spectrum Quality Products (Gardena, CA). Specific amounts of TCDD dissolved in acetone were added to corn oil to yield concentrations of 0, 1.2, 4, 8.8, 18.4, or 40 ng TCDD per ml of vehicle (acetone/corn oil = 1/99).
Animals and Treatments: Female Harlan Sprague– Dawley rats (Harlan Sprague–Dawley, Inc., Indianapolis, IN; body weight 150–176 g) were chosen because they are commonly used in subchronic and chronic studies with dioxin-like compounds and for the calculation of TEF values (Gao et al., 2000; Haag-Gronlund et al., 1998; van der Plas et al., 2000). After acclimation and randomization by body weight, groups of 53–54 rats were administered 0 (control), 3, 10, 22, 46, or 100 ng TCDD/kg body weight in corn oil (2.5 ml/kg) by gavage once daily, 5 days per week for up to 2 years. In this study the group given 100 ng/kg/day TCDD was designated the high-dose group; an additional group treated with 100 ng/kg/day for 30 weeks followed by vehicle treatment through the termination of the 2-year study was designated the stop group. For the histological and immunohistochemical assessments, 10 animals, from each of the dose groups containing the approximately 50 animals, were selected on the basis of their assigned numbers; the lowest 10 numbers of the surviving animals were chosen, thus imparting indiscrimination to the analysis. Rats were housed 5 per solid polycarbonate cage (Lab Products Inc., Maywood, NJ) bedded with irradiated Sani-Chips hardwood chips (P. J. Murphy Forest Products Corp., Montville, NJ). Animal-room environmental controls were set to maintain a temperature of 69– 75◦F and a relative humidity of 35–65%, with a minimum of 10 fresh air changes per hr and exactly 12 hr of fluorescent light daily. Animals were allowed free access to irradiated NTP-2000 pelleted feed (Zeigler Brothers, Inc., Gardners, PA) and tap water. Background daily intake of TCDD in the control through feed and corn oil was estimated to be approximately 6 pg/kg/day. All animal experiments were performed at a facility accredited by the Association for Assessment and Accreditation of Laboratory Animal Care.
Histology and Morphometry: Hematoxylin and eosinstained thyroid tissue slices were examined for the presence of neoplastic and nonneoplastic lesions. The thyroids of animals were analyzed morphometrically, as described elsewhere (Capen et al., 2001; Nishimura et al., 2002; Sewall et al., 1995), with minor modifications. Briefly, digital pictures of 10 nonadjacent 10× fields (5 pictures from each lobe) were taken. Two follicles that were localized on or closest to 2 fixed coordinates were selected in each picture, resulting in 20 follicles to be analyzed. Using NIH Image, version 1.61, and a pixel-to-square-micrometer conversion, we measured areas of each follicle and its lumen. The epithelial area was then calculated by subtracting the luminal area from the follicular area, and the luminal/epithelial area ratio (L/E) was calculated. This parameter is a combined measurement that reflects TCDD-related increases in thyroid follicular hypertrophy as well as decreases in the follicle size. In the same 20 follicles, the sectional height of lining epithelial cells (SEH) was also measured using NIH Image. The SEH was defined as the mean of the vertical lengths of 4 epithelial cells that were measured every 90 degrees in each follicle. The value reported for each animal represents the mean of 20 follicles per tissue section.
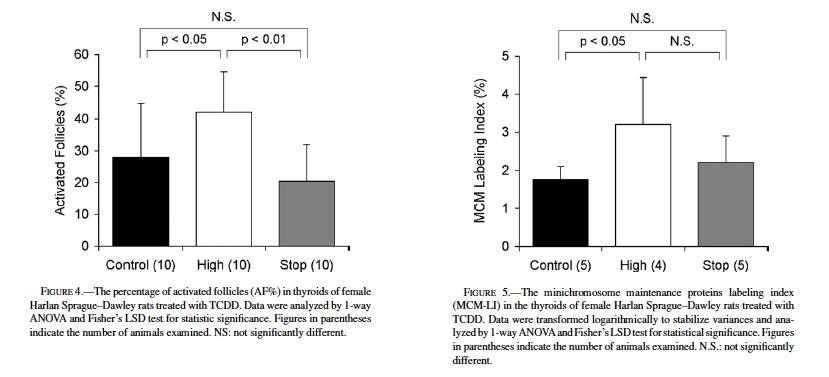
Follicular colloid condition, which serves as a marker of thyroid function, was also evaluated. Follicles with eosinophilic homogenous colloid were defined as “inactivated” follicles, and those with colloid that looked granular and/or resorbed were regarded as being functionally “activated.” A digital file of a grid of fine lines with a 2-inch interval was created and layered on one of the thyroid pictures on the platform of the NIH Image. The grid file had 12 points of intersection, and inactivated and activated follicles were respectively counted when they had an obvious lumen and were on one of the intersections. The percentage of activated follicles (AF%) was calculated for each animal by dividing the number of activated follicles by the sum of activated and inactivated follicles.
MCM Labeling Index: To elucidate the proliferative activity of follicular epithelial cells, antibody to MCM protein was used. MCM antibody was selected in the present study because preliminary studies revealed that the antibody reacted with more nuclei than antibodies against PCNA and Ki-67 (data not shown). The usefulness of MCM antibody is known to be comparable to that of Ki-67 (Wharton et al., 2001).
Immunohistochemistry was performed using the avidinbiotin peroxidase method on the Nexes (Ventana Medical Systems, Inc., Tucson, AZ) automated instrument for immunohistochemistry. Sections of thyroids from 4 or 5 of the 10 lowest-numbered animals from each dose group were stained using a polyclonal antibody to MCM protein mixture 2–7 (BD Biosciences Pharmingen, San Diego, CA) at a concentration of 1:300. Sections of the gastrointestinal tract of the mouse were used as an external positive control tissue for the stain. Following rehydration through a series of graded alcohols, all slides were placed in 1× Automation Buffer (1× AB) (Biomeda Corp., Foster city, CA). Following the buffer wash, heat-induced epitope retrieval was completed by placing the slides in distilled water in the microwave oven. Slides were cooled for 20 min, rinsed in distilled water, and placed on the Nexes using a titration run with the AB detection Kit (Ventana) without amplification. The primary antibody incubation time was 32 min. Upon completion of the stain, the slides were removed from the instrument and placed in warm tap water with a detergent to remove the Liquid Coverslip (Ventana). After rinsing in water, sections were counterstained with Harris hematoxylin (Harleco, Gibbstown, NJ), blued in 1X AB, dehydrated through a series of graded alcohols, and coverslipped with Permount (Surgipath Medical Industries, Inc., Richmond, IL).
The nuclei in MCM-stained sections were observed and counted by light microscopy. For each animal, 1000 nuclei were counted, and the numbers of MCM-positive and MCM-negative nuclei were recorded. The MCM labeling index (MCM-LI) was calculated by dividing the number of MCM-positive nuclei by the total number of nuclei counted. In addition, if available in the same slices, the MCM-LI of C-cell hyperplasias and adenomas was also examined as an internal positive control.
TUNEL Staining: ApopTag In Situ Apoptosis Detection Kit (Intergen Company, Purchase, NY) was used to detect apoptotic cells by the terminal deoxyribonucleotidyl transferase-mediated dUTP nick end labeling (TUNEL) assay (Gavrieli et al., 1992). From the control and high-dose groups, 3 animals per group were selected for this method. The stop group was not evaluated.
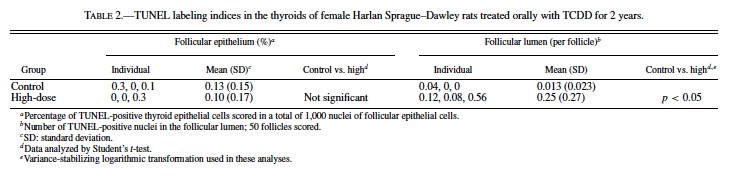
Apoptotic cells were identified by a brown to black nuclear pigment. TUNEL-positive cells were identified by morphologic criteria as well as location within the thyroid. Follicular cells that stained positively by TUNEL were scored in a total of 1,000 nuclei of follicular epithelial cells. The number of TUNEL-positive cells in the follicular lumen was scored in 50 follicles located at the center of the thyroid. The ratio of TUNEL-positive cells per 1,000 cells counted (for the follicular epithelium) or per 50 follicles (for the lumen) was designated as the TUNEL labeling index (TUNEL-LI).
Statistics: Summary data are expressed as the mean ± standard deviation (SD). One-way Analysis of Variance (ANOVA) procedures were used to determine whether the variables of interest (L/E, SEH, and MCM-LI) were significantly different among the 3 experimental groups. If significant differences were detected, pairwise comparisons were made by Fisher’s Least Significant Difference (LSD) test (Miller, 1966). To evaluate the significance of the difference in TUNEL-LI between the control and high-dose groups, the Student’s t-test was performed. For some variables, the logarithmic transformation was used to stabilize the variances.
RESULTS
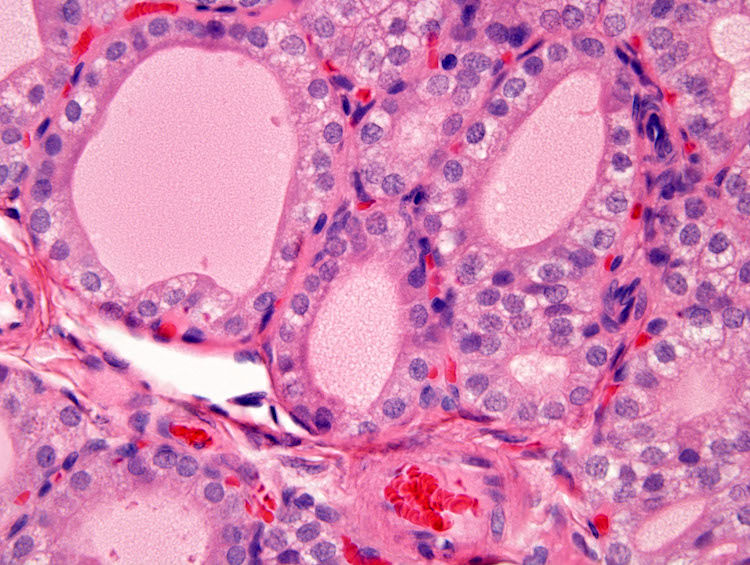
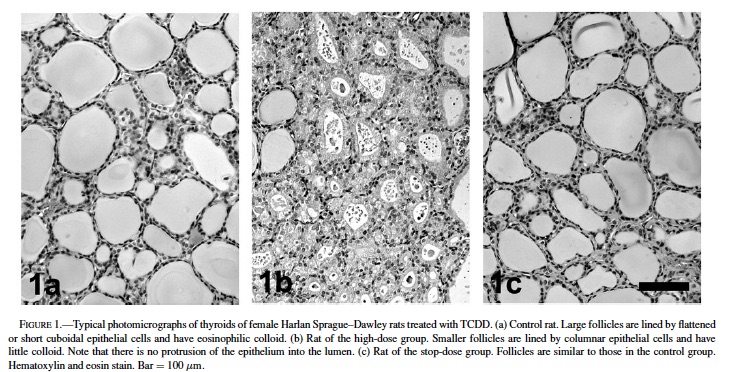
In the treated groups, follicular epithelial cells were generally altered from flattened or short cuboidal to tall cuboidal or columnar, and the size of follicles was decreased, compared with the control group (Fig. 1). Most of the follicles exhibited a rounded shape and did not protrude into the luminal space. These morphological characteristics suggest that these lesions are hypertrophic. The size of follicles was heterogeneous in each thyroid; morphometric analysis is sufficiently powerful to determine morphological differences.
Fig. 2 shows the TCDD-related changes reflected in L/E values. The L/E of the high-dose group (1.72 ± 0.60) was significantly decreased from that of the control group (2.76 ± 1.08, p < 0.01). The L/E of the stop group (2.46 ± 0.64) was significantly greater than that of the high-dose group (p < 0.05), though it was comparable to the control value.
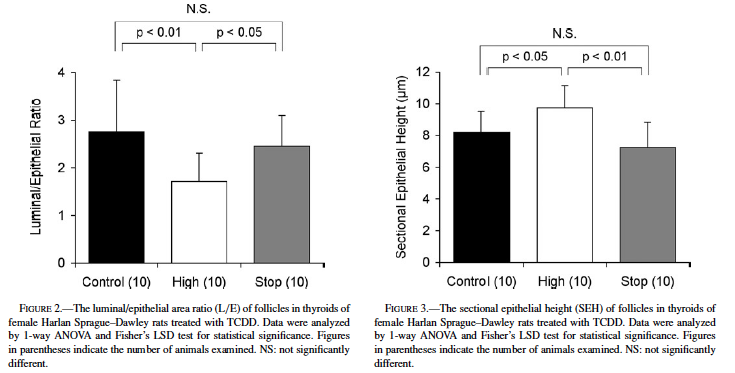
The results of SEH measurements are shown in Fig. 3. TCDD treatment significantly increased the SEH of the high-dose group (9.72 ± 1.42 µm, p < 0.05) compared with that of the control (8.19 ± 1.32 µm). The SEH of the stop group (7.24 ± 1.58 µm) was significantly lower than that of the high-dose group (p < 0.01) but comparable to the control level.
The histological appearance of follicular colloid is considered a reliable indicator of thyroid activation. In general, the follicle is inactivated when colloid is eosinophilic and homogenous; when the follicle is in an activated condition, colloid appears granular or basophilic due to its resorption by follicular epithelium (Hardisty and Boorman, 1990, 1999). The AF% values are shown in Fig. 4. The AF% of the control was 28.0 ± 16.9%, while that of the high-dose group was significantly higher (42.2 ± 12.4%; p < 0.05). The AF% of the stop group was 20.4 ± 11.4%, comparable to that of the control but significantly lower than the high-dose value (p < 0.01).
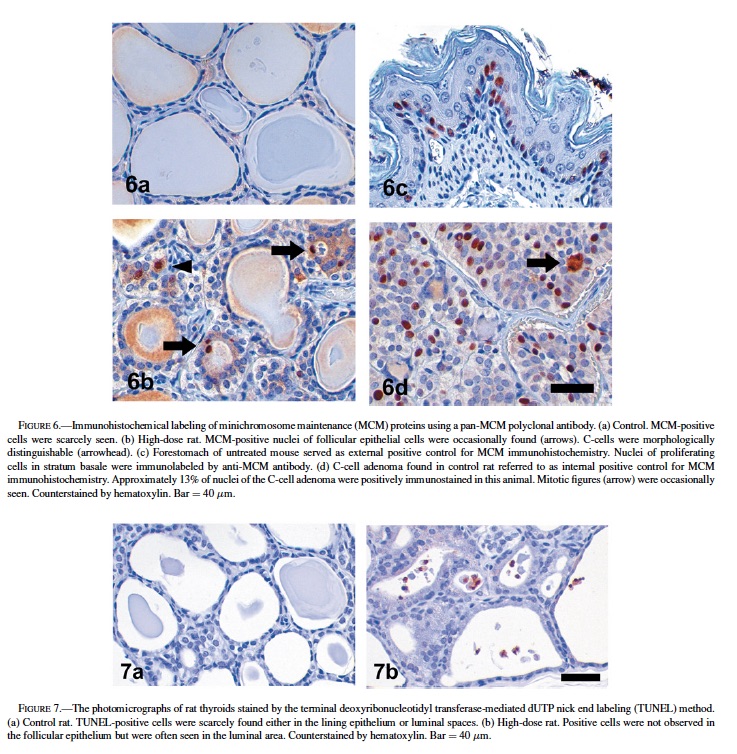
Immunohistochemical detection of MCM proteins was performed to evaluate their proliferative activities and expressed as a representative parameter of LI. Fig. 5 presents the numerical data for MCM-LIs, and Fig. 6 shows typical photographs of MCM-immunostained thyroid sections. Most of the nuclei of follicular lining cells of the control rats were negative to MCM (1.76 ± 0.34%, Figs. 5, 6a). The mean MCM-LI of the high-dose group (3.21 ± 1.23%, Figs. 5, 6b) was significantly higher than that of the control group, but there were no significant differences between the stop group (2.20 ± 0.70%) and other groups (Fig. 5). The antibody strongly reacted with nuclei of epithelial cells in murine forestomach that served as an external positive control (Fig. 6c). In C-cell hyperplasias and adenomas, preneoplastic or neoplastic cells exhibited 5% to 27% labeling, supporting the contention that this antibody worked well to highlight replicating cells in proliferative lesions (Fig. 6d).
Though MCM-LIs of the control and high-dose groups were relatively lower compared to those of C-cell proliferative lesions, there was a significant difference between these 2 groups. To determine whether follicular epithelial cells increased in total, we also counted the number of apoptotic cells. The results are shown in Table 2. Apoptotic cells were scarcely found in the follicular epithelium of both the control and high-dose groups. At most, only 0.3% of follicular epithelial cells were apoptotic (Table 2, Fig. 7). In contrast, when observed only in the follicular lumen, significantly more apoptotic cells were found in the high-dose group compared to the control (p < 0.05) (Table 2, Fig. 7). The TUNEL-LIs of the control group ranged from 0 to 0.04 per follicle, while those of the high-dose group were 0.08, 0.12, and 0.56 per follicle.
DISCUSSION
The mechanism of action of TCDD is believed to be disruption of thyroid hormone homeostasis via the induction of the phase II enzymes, UDP-glucuronosyltransferases (Kohn, 2000; Kohn et al., 1996; Schuur et al., 1997; Sewall et al., 1995; van Birgelen et al., 1995; van der Plas et al., 2001). Thyroxine (T4) production and secretion are controlled by thyroid-stimulating hormone (TSH), which is under negative and positive regulation from the hypothalamus, pituitary, and thyroid by thyrotropin-releasing hormone, TSH itself, T4, and triiodothyronine. TCDD induces the synthesis of UDP-glucuronosyltransferase-1 mRNA by an aryl hydrocarbon receptor-dependent transcriptional mechanism (Bock et al., 1998; Yueh et al., 2003). A consequent reduction in serum T4 levels caused by an induction in conjugation by TCDD-induced UGT may lead to a decrease in the negative feedback inhibition on the pituitary gland. This would subsequently induce a rise in secreted thyroid-stimulating hormone resulting in chronic hyperstimulation of the thyroid follicular cells (Sewall et al., 1995). Such intense stimulation may cause pathological changes including hypertrophy and hyperplasia, progressing to neoplastic lesions.
The reason for the lack of progression of the TCDD-related changes to neoplasia is unknown. Carcinogenic activity of TCDD in the thyroid follicles of Osborne-Mendel rats was previously reported (National Toxicology Program, 1982a). In that study male rats showed a dose-related (10, 100, 500 ng/kg/day) increase in the incidence of follicular adenoma, while an increase in the incidence of adenoma was observed only in the 500 ng/kg/day group in females. This dose was much higher than the highest dose (100 ng/kg/day) in the original study of this report (National Toxicology Program, 2004).
This information leads to speculation that female rats are less susceptible to thyroid follicular adenoma than males and that the dose used here was insufficient to induce follicular adenomas in females. Thyroid hormonal analysis was performed in the original study (National Toxicology Program, 2004). The levels of TSH were measured at three interim sacrifices (14, 31, and 53 weeks), but only at 53 weeks were the levels significantly higher in the 100 ng/kg animals compared to controls. That the levels of TSH did not remain high enough for a sufficiently long period of time to promote proliferation of the follicular cells is speculated. Another possibility is that the thyroid of rats can be desensitized to the action of TSH if a goitrogen is administered for a prolonged period of time (Shimo et al., 1994; Takizawa et al., 2003; Wynford-Thomas et al., 1982).
As determined by image analysis, nonneoplastic lesions in the follicular epithelium occurred in a dose-dependent fashion. Morphologically, this lesion type consisted of smaller follicles and larger height of lining epithelial cells with no prominent protrusion of epithelium into the luminal area. Morphometrical evaluations of the follicular cells are sensitive indicators of potential toxic effects of xenobiotics on the thyroid gland (Capen, 2001; Nishimura et al., 2002). The L/E represents the magnitude of sizes of both follicles and luminal spaces (Capen, 2001; Nishimura et al., 2002; Sewall et al., 1995). Follicles with large L/Es exhibit flattened lining epithelium and a vast amount of colloid in large luminal spaces and should be classified as inactivated ones. In contrast, follicles lined by hypertrophied, thickened epithelial cells; containing basophilic or pale colloid within a narrower luminal area; and with relatively small L/Es may be considered activated. The SEH is another parameter indicative of hypertrophy of follicular epithelium. In the present study, that the L/E was lower and the SEH higher in the rats treated with 100 ng/kg/day TCDD, compared to values in the control rats, strongly suggests that chronic exposure of rats to TCDD causes follicular epithelial-cell hypertrophy. The other variable in this study, AF%, based on qualitative morphology of the follicular colloid, also supports this concept. TCDD treatment raised AF% in the thyroid significantly relative to that of the controls. Taken together, all of the morphological parameters, both quantitative and qualitative, were strongly indicative of hypertrophy.
Limited investigations have utilized MCM antibody in rodent cell culture studies (Bruemmer et al., 2003a, 2003b), but, to the best of our knowledge, MCM proteins have not been applied to rodent pathology. In the present study we tested its presence in mouse intestinal tissues as external controls and rat C-cell proliferative lesions as internal controls; the results showed that this useful biomarker identifies cellular proliferation immunohistochemically, for both normal and neoplastic rodent tissues. The MCM-LI of follicular epithelial cells in the high-dose group (1.76 ± 0.34%) was significantly higher than that of follicular epithelial cells in the control group (3.21 ± 1.23%). This result might suggest simplistically that the follicular lesion is hyperplastic; however, these data were close to each other in value, and the MCM-LIs of C-cell proliferative lesions (5–27%) were much greater than those of follicular epithelial cells. An increase in the number of cells (hyperplasia) must depend on the balance between the number of proliferating cells (represented as MCM-LI) and the number of dead cells (scored as TUNEL-positive cells). Although the percentage of TUNEL-positive cells in the follicular epithelium was comparable between the control and the high-dose groups, the TUNEL-positive cell count in the follicular lumen of the high-dose group was much higher than that in the follicular lumen of the control. This observation may imply that some excess number of epithelial cells became apoptotic in the lumina, resulting in a condition other than hyperplasia. Also implicit is the indication that, while the small increase in the MCM-LI was statistically significant, it probably does not hold biological significance, since the TUNEL-LI was also higher in the high-dose group.
In this study, our examination of the stop group elucidated the effect of withdrawal of TCDD treatment on the follicular lesion. The L/E, SEH, and AF% of the stop group were significantly different from the respective parameters of the high-dose group, and these as well as the MCM-LI of the stop group were comparable to the respective parameters of the control group. In the original NTP study, there was a dose-related increase in the incidence of thyroid follicular cell hypertrophy in the interim-sacrificed rats treated for 31 weeks (National Toxicology Program, 2004). Other investigators (Sewall et al., 1995) also described the induction of follicular hypertrophy by TCDD within 30 weeks. Taken together, these results indicate that the long-term withdrawal of TCDD treatment could cause regression of follicular cell hypertrophy.
In conclusion, the data obtained from the present study, including morphological characteristics, indicate that these lesions should be diagnosed as follicular cell hypertrophy, not hyperplasia or atrophy, and that they are reversible.
ACKNOWLEDGMENTS
The authors thank Dr. Sandra R. Eldridge for TUNEL staining and counting cells. We gratefully acknowledge Ms. JoAnne Johnson and Drs. June Dunnick and Kamal Abdo from the NIEHS for their critical review of the manuscript. Appreciation is expressed to Mr. Norris Flagler for his expertise in instruction of morphometric image analysis. We express gratitude to Dr. Amy Brix from Experimental Pathology Laboratories, Inc., Research Triangle Park, NC, Dr. Michael Jokinen from Pathology Associates, Durham, NC, and Dr. Donald Sells, Battelle Memorial Institute, Columbus, OH, for the high quality pathological evaluation. We thank Drs. John Bucher, Angelique van Birgelen, Denise Orzech and Cynthia Smith from NIEHS and Dr. Milton Hejtmancik from Battelle Memorial Institute for their valued contributions to study design.
REFERENCES
Ahlborg, U. G., A. Brouwer, M. A. Fingerhut, J. L. Jacobson, S. W. Jacobson, S. W. Kennedy, A. A. Kettrup, J. H. Koeman, H. Poiger, C. Rappe, S. H. Safe, R. F. Seegal, J. Tuomisto, J., and H. van den Berg (1992). “Impact of Polychlorinated Dibenzo-p-dioxins, Dibenzofurans, and Biphenyls on Human and Environmental Health, with Special Emphasis on Application of the Toxic Equivalency Factor Concept.” Eur J Pharmacol 228: 179–99.
Alison, M. R., T. Hunt, and S. J. Forbes (2002). “Minichromosome Maintenance (MCM) Proteins May be Pre-Cancer Markers.” Gut 50: 290–1.
Barnes, D. G. (1991). “Toxicity Equivalents and EPA’s Risk Assessment of 2,3,7,8-TCDD.” Sci Total Environ 104: 73–86.
Becher, H., D. Flesch-Janys, T. Kauppinen, M. Kogevinas, K. Steindorf, A. Manz, and J. Wahrendorf (1996). “Cancer Mortality in German Male Workers Exposed to Phenoxy Herbicides and Dioxins.” Cancer Causes Control 7: 312–21.
Bock, K. W., H. Gschaidmeier, H. Heel, T. Lehmkoster, P. A. Munzel, F. Raschko, and B. Bock-Hennig (1998). “Ah Receptor-Controlled Transcriptional Regulation and Function of Rat and Human UDP-Glucuronosyltransferase Isoforms.” Adv Enzyme Regul 38: 207–22.
Bruemmer, D., F. Yin, J. Liu, J. P. Berger, T. Kiyono, J. Chen, E. Fleck, A. J. Van Herle, B. M. Forman, and R. E. Law (2003a). “Peroxisome Proliferatoractivated Receptor gamma Inhibits Expression of Minichromosome Maintenance Proteins in Vascular Smooth Muscle Cells.” Mol Endocrinol 17: 1005–18.
Bruemmer, D., F. Yin, J. Liu, T. Kiyono, E. Fleck, A. Van Herle, K. Graf, and R. E. Law (2003b). “Atorvastatin Inhibits Expression of Minichromosome Maintenance Proteins in Vascular Smooth Muscle Cells.” Eur J Pharmacol 462: 15–23.
Capen, C. C. (2001). “Overview of Structural and Functional Lesions in Endocrine Organs of Animals.” Toxicol Pathol 29: 8–33.
Capen, C. C., R. A. DeLellis, and J. T. Yarrington (2001). “Endocrine system. Handbook of Toxicologic Pathology.” W. M. Haschek, C. G. Rousseaux and M. A. Wallig. Vol. 2. Academic Press, San Diego, CA.
Chong, J. P., H. M. Mahbubani, C. Y. Khoo, and J. J. Blow (1995). “Purification of an MCM-Containing Complex as a Component of the DNA Replication Licensing System.” Nature 375: 418–21.
Della Porta, G., T. A. Dragani, and G. Sozzi (1987). “Carcinogenic Effects of Infantile and Long-Term 2,3,7,8-tetrachlorodibenzo-p-dioxin Treatment in the Mouse.” Tumori 73: 99–107.
Fahrig, R. (1993). “Genetic Effects of Dioxins in the Spot Test with Mice.” Environ Health Perspect 101 (Suppl 3): 257–61.
Fingerhut, M. A., W. E. Halperin, D. A. Marlow, L. A. Piacitelli, P. A. Honchar, M. H. Sweeney, A. L. Greife, P. A. Dill, K. Steenland, and A. J. Suruda (1991). “Cancer Mortality in Workers Exposed to 2,3,7,8- tetrachlorodibenzo-p-dioxin.” N Engl J Med 324: 212–8.
Freeman, A., L. S. Morris, A. D. Mills, K. Stoeber, R. A. Laskey, G. H. Williams, and N. Coleman (1999). “Minichromosome Maintenance Proteins as Biological Markers of Dysplasia and Malignancy.” Clin Cancer Res 5: 2121– 32.
Gao, X., P. F. Terranova, and K. K. Rozman (2000). “Effects of Polychlorinated Dibenzofurans, Biphenyls, and Their Mixture with dibenzo-p-dioxins on Ovulation in the Gonadotropin-Primed Immature Rat: Support for the Toxic Equivalency Concept.” Toxicol Appl Pharmacol 163: 115–24.
Gavrieli, Y., Y. Sherman, and S. A. Ben-Sasson (1992). “Identification of Programmed Cell Death In Situ Via Specific Labeling of Nuclear DNA Fragmentation.” J Cell Biol 119: 493–501.
Geiger, L. E. and R. A. Neal (1981). “Mutagenicity Testing of 2,3,7,8- tetrachlordibenzo-p-dioxin in Histidine Auxotrophs of Salmonella typhimurium.” Toxicol Appl Pharmacol 59: 125–9.
Gorski, J. R. and K. Rozman (1987). “Dose-response and Time Course of Hypothyroxinemia and Hypoinsulinemia and Characterization of Insulin Hypersensitivity in 2,3,7,8-tetrachlorodibenzo-p-dioxin (TCDD)-treated Rats.” Toxicology 44: 297–307.
Haag-Gronlund, M., N. Johansson, R. Fransson-Steen, H. H ¨ akansson, G. Scheu, ˚ and L. Warng ¨ ard (1998). ˚ “Interactive Effects of Three Structurally Different Polychlorinated Biphenyls in a Rat Liver Tumor Promotion Bioassay.” Toxicol Appl Pharmacol 152: 153–65.
Hardisty, J. F. and G. A. Boorman (1990). Thyroid gland. Pathology of the Fischer Rat. Reference and Atlas. G. A. Boorman, S. L. Eustis, M. R. Elwell, C. A. Montgomery, Jr., and W. F. MacKenzie. Academic Press, San Diego, CA.
Hardisty, J. F. and G. A. Boorman (1999). Thyroid and parathyroid glands. Pathology of the Mouse. Reference and Atlas. R. R. Maronpot. Cache River Press, Vienna, IL.
Henry, E. C. and T. A. Gasiewicz (1987). “Changes in Thyroid Hormones and Thyroxine Glucuronidation in Hamsters Compared with Rats Following Treatment with 2,3,7,8-tetrachlorodibenzo-p-dioxin.” Toxicol Appl Pharmacol 89: 165–74.
International Agency for Research on Cancer (1997). Polychlorinated dibenzop-dioxins and polychlorinated dibenzofurans. IARC Monographs on the Evaluation of the Carcinogenic Risks to Humans, Vol. 69. IARC Scientific Publications, Lyon, France.
Kociba, R. J., D. G. Keyes, J. E. Beyer, R. M. Carreon, C. E. Wade, D. A. Dittenber, R. P. Kalnins, L. E. Frauson, C. N. Park, S. D. Barnard, R. A. Hummel, and C. G. Humiston (1978). “Results of a Two-Year Chronic Toxicity and Oncogenicity Study of 2,3,7,8-tetrachlorodibenzo-p-dioxin in Rats.” Toxicol Appl Pharmacol 46: 279–303.
Kodani, I., K. Shomori, M. Osaki, I. Kuratate, K. Ryoke, and H. Ito (2001). “Expression of Minichromosome Maintenance 2 (MCM2), Ki-67, and Cell-Cycle-Related Molecules, and Apoptosis in the Normal-DysplasiaCarcinoma Sequence of the Oral Mucosa.” Pathobiology 69: 150–8.
Kohn, M. C. (2000). “Effects of TCDD on Thyroid Hormone Homeostasis in the Rat.” Drug Chem Toxicol 23: 259–77.
Kohn, M. C., C. H. Sewall, G. W. Lucier, and C. J. Portier (1996). “A Mechanistic Model of Effects of Dioxin on Thyroid Hormones in the Rat.” Toxicol Appl Pharmacol 136: 29–48.
Kubota, Y., S. Mimura, S. Nishimoto, H. Takisawa, and H. Nojima (1995). “Identification of the Yeast MCM3-Related Protein as a Component of Xenopus DNA Replication Licensing Factor.” Cell 81: 601–9.
Madine, M. A., C. Y. Khoo, A. D. Mills, and R. A. Laskey (1995). “MCM3 Complex Required for Cell Cycle Regulation of DNA Replication in Vertebrate Cells.” Nature 375: 421–4.
Miller, R. G. (1966). Simultaneous Statistical Inference. McGraw-Hill, New York.
National Toxicology Program (1982a). Carcinogenesis Bioassay of 2,3,7,8- Tetrachlorodibenzo-p-dioxin (CAS No. 1746-01-6) in Osborne-Mendel Rats and B6C3F1 Mice (Gavage Study). NTP TR 209, NIH Publication No. 82-1765. National Toxicology Program, Research Triangle Park, NC.
National Toxicology Program (1982b). Carcinogenesis Bioassay of 2,3,7,8- Tetrachlorodibenzo-p-dioxin (CAS No. 1746-01-6) in Swiss-Webster Mice (Dermal Study). NTP TR 201, NIH Publication No. 82-1757. National Toxicology Program, Research Triangle Park, NC.
National Toxicology Program (2003). Toxicology and Carcinogenesis Studies of 2,3,7,8-Tetrachlorodibenzo-p-dioxin (CAS No. 1746-01-6) in Female Harlan Sprague–Dawley Rats (Gavage Studies). National Toxicology Program, Research Triangle Park, NC (in preparation).
Nishimura, N., Y. Miyabara, M. Sato, J. Yonemoto, and C. Tohyama (2002). “Immunohistochemical Localization of Thyroid Stimulating Hormone Induced by a Low Oral Dose of 2,3,7,8-tetrachlorodibenzo-p-dioxin in Female Sprague–Dawley Rats.” Toxicology 171: 73–82.
Ott, M. G. and A. Zober (1996). “Cause Specific Mortality and Cancer Incidence among Employees Exposed to 2,3,7,8-TCDD after a 1953 Reactor Accident.” Occup Environ Med 53: 606–12.
Potter, C. L., I. G. Sipes, and D. H. Russell (1983). “Hypothyroxinemia and Hypothermia in Rats in Response to 2,3,7,8-tetrachlorodibenzo-p-dioxin Administration.” Toxicol Appl Pharmacol 69: 89–95.
Rao, M. S., V. Subbarao, J. D. Prasad, and D. G. Scarpelli (1988). “Carcinogenicity of 2,3,7,8-tetrachlorodibenzo-p-dioxin in the Syrian Golden Hamster.” Carcinogenesis 9: 1677–9.
Rodins, K., M. Cheale, N. Coleman, and S. B. Fox (2002). “Minichromosome Maintenance Protein 2 Expression in Normal Kidney and Renal Cell Carcinomas: Relationship to Tumor Dormancy and Potential Clinical Utility.” Clin Cancer Res 8: 1075–81.
Saracci, R., M. Kogevinas, P. A. Bertazzi, B. H. Bueno de Mesquita, D. Coggon, L. M. Green, T. Kauppinen, K. A. L’Abbe, M. Littorin, E. Lynge, J. D. Mathews, M. Neuberger, J. Osman, N. Pearce, and R. Winkelmann (1991). “Cancer Mortality in Workers Exposed to Chlorophenoxy Herbicides and Chlorophenols.” Lancet 338: 1027–32.
Schuur, A. G., F. M. Boekhorst, A. Brouwer, and T. J. Visser (1997). “Extrathyroidal Effects of 2,3,7,8-tetrachlorodibenzo-p-dioxin on Thyroid Hormone Turnover in Male Sprague–Dawley Rats.” Endocrinology 138: 3727–34.
Sewall, C. H., N. Flagler, J. P. Vanden Heuvel, G. C. Clark, A. M. Tritscher, R. R. Maronpot, and G. W. Lucier (1995). “Alterations in Thyroid Function in Female Sprague–Dawley Rats Following Chronic Treatment with 2,3,7,8-tetrachlorodibenzo-p-dioxin.” Toxicol Appl Pharmacol 132: 237–44.
Shimo, T., K. Mitsumori, H. Onodera, K. Yasuhara, M. Takahashi, Y. Ueno, and Y. Hayashi (1994). “Time Course Observation of Thyroid Proliferative Lesions and Serum TSH Levels in Rats Treated with Thiourea after DHPN Initiation.” Cancer Lett 85: 141–9.
Takizawa, T., K. Mitsumori, T. Tamura, M. Nasu, M. Ueda, T. Imai, and M. Hirose (2003). “Hepatocellular Tumor Induction in Heterozygous p53- Deficient CBA Mice by a 26-Week Dietary Administration of Kojic Acid.” Toxicol Sci 73: 287–93.
van Birgelen, A. P., E. A. Smit, I. M. Kampen, C. N. Groeneveld, K. M. Fase, J. Van der Kolk, H. Poiger, M. Van den Berg, J. H. Koeman, and A. Brouwer (1995). “Subchronic Effects of 2,3,7,8-TCDD or PCBs on Thyroid Hormone Metabolism: Use in Risk Assessment.”Eur J Pharmacol 293: 77–85.
van der Plas, S. A., I. Lutkeschipholt, B. Spenkelink, and A. Brouwer (2001). “Effects of Subchronic Exposure to Complex Mixtures of Dioxin-Like and Non-dioxin-like Polyhalogenated Aromatic Compounds on Thyroid Hormone and Vitamin A Levels in Female Sprague–Dawley Rats.” Toxicol Sci 59: 92–100.
van der Plas, S. A., H. Sundberg, H. van den Berg, G. Scheu, P. Wester, S. Jensen, A. Bergman, J. de Boer, J. H. Koeman, and A. Brouwer (2000). “Contribution of Planar (0-1 ortho) and Nonplanar (2-4 ortho) Fractions of Aroclor 1260 to the Induction of Altered Hepatic Foci in Female Sprague– Dawley Rats.” Toxicol Appl Pharmacol 169: 255–68.
Wharton, S. B., K. K. Chan, J. R. Anderson, K. Stoeber, and G. H. Williams (2001). “Replicative Mcm2 Protein as a Novel Proliferation Marker in Oligodendrogliomas and its Relationship to Ki67 Labelling Index, Histological Grade and Prognosis.” Neuropathol Appl Neurobiol 27: 305–13.
Wynford-Thomas, D., B. M. Stringer, and E. D. Williams (1982). “Desensitisation of Rat Thyroid to the Growth-Stimulating Action of TSH During Prolonged Goitrogen Administration. Persistence of Refractoriness Following Withdrawal of Stimulation.” Acta Endocrinol (Copenh) 101: 562–9.
Yueh, M. F., Y. H. Huang, A. Hiller, S. Chen, N. Nguyen, and R. H. Tukey, (2003). “Involvement of the Xenobiotic Response Element (XRE) in Ah ReceptorMediated Induction of Human UDP-Glucuronosyltransferase 1A1.” J Biol Chem 278: 15001–6