Hepatic enzyme induction is generally an adaptive response associated with increases in liver weight, induction of gene expression, and morphological changes in hepatocytes. The additive growth and functional demands that initiated the response to hepatic enzyme induction cover a wide range of stimuli including pregnancy and lactation, hormonal fluctuations, dietary constituents, infections associated with acute-phase proteins, as well as responses to exposure to xenobiotics. Common xenobiotic enzyme inducers trigger pathways involving the constitutive androstane receptor (CAR), the peroxisome proliferator-activated receptor (PPAR), the aryl hydrocarbon receptor (AhR), and the pregnane-X-receptor (PXR). Liver enlargement in response to hepatic enzyme induction is typically associated with hepatocellular hypertrophy and often, transient hepatocyte hyperplasia. The hypertrophy may show a lobular distribution, with the pattern of lobular zonation and severity reflecting species, strain, and sex differences in addition to effects from specific xenobiotics. Toxicity and hepatocarcinogenicity may occur when liver responses exceed adaptive changes or induced enzymes generate toxic metabolites. These undesirable consequences are influenced by the type and dose of xenobiotic and show considerable species differences in susceptibility and severity that need to be understood for assessing the potential effects on human health from similar exposures to specific xenobiotics.
Keywords
hepatocellular hypertrophy, liver toxicity, hepatocellular hyperplasia, liver carcinogenesis, xenobiotic enzyme inducers, P450.
Introduction
Hepatic enzyme induction may be associated with changes in liver weight, histological evidence of abnormal hepatocytes, alteration of serum clinical chemistry analytes (Ennulat et al. 2010), and pleotrophic gene expression. General background information relative to enzyme induction as covered in the introductory overview is typically compartmentalized into Phase I and Phase II induction (Botts et al. 2010). Phase I oxidative metabolism is catalyzed by various isoforms of the P450 superfamily and occurs in the microvesicles of the hepatocyte smooth endoplasmic reticulum. The classification and functions of the large family of P450 (CYP) enzymes have been reviewed with identification of species-specific isoforms (Martignoni et al. 2006).
The liver is responsible for maintenance of normal homeostasis and physiological functions. It functions as a conditional system capable of relatively rapid responses to a variety of stimuli. Liver size is governed both by genetic factors and by the rate of biochemical activity to maintain optimal functional mass. Following stimuli such as toxic insult, infection, or partial hepatectomy, the liver rapidly restores its optimal mass to maintain normal function. The liver also readily responds to some stimuli by undergoing additive growth and function. Growth and functional demands that promote a liver response span a range of stimuli, including pregnancy and lactation; hormonal fluctuations; dietary constituents such as fat, carbohydrates and proteins; viral and bacterial infections that induce acute-phase proteins; and enzyme inductive responses to a variety of xenobiotics. The hepatic response to these various stimuli may involve an increase in liver size and functional capacity attributable to an increase in size and/or number of hepatocytes.
This review addresses factors influencing common hepatic enzyme inducers and the morphological features of hepatic enzyme induction including adaptive and adverse responses.
Common Xenobiotic Induction Pathways and Effect On Liver Morphology
Induction Involving Constitutive Androstane Receptor
Barbiturates and chemicals that induce CYP2B initially interact with the constitutive androstane receptor (CAR) that translocates to the nucleus and dimerizes with the retinoid-X-receptor (RXR). The dimer then binds to specific response elements, resulting in transcriptional activation of genes regulating P450 expression (Liang et al. 1995; Sueyoshi and Negishi 2001). Phenobarbital is a prototypical xenobiotic that acts through the CAR receptor. Phenobarbital-induced liver enlargement is associated with initial transient hyperplasia in rodents as an early event after treatment and a substantial proliferation of smooth endoplasmic reticulum, causing hepatocellular hypertrophy. The hypertrophy typically affects all of the centrilobular hepatocytes and 45% of periportal hepatocytes in rats (Massey and Butler 1979). Differences in the response may be influenced by the species, sex, age of the animals, and the barbiturate dose (Crampton et al. 1977a; Massey and Butler 1979; Schlede and Borowski 1974). Increasing the dose of phenobarbitone in the rat will correlate with liver enlargement and enzyme induction only up to a point, after which there is no further increased liver enlargement and hepatotoxicity observed (Crampton et al. 1977a). Prolonged phenobarbitone exposure results in induction of hepatocellular neoplasms in mice and rats (Greaves 2007; Holsapple et al. 2006; Kunz et al. 1983; Wastl et al. 1998; Whysner et al. 1996).
Following administration of phenobarbital via drinking water to F344 rats for three weeks, increased liver weight was found to be a result of hepatocellular hypertrophy, hyperplasia, and enlargement of the hepatic blood space (Massey and Butler 1979). The authors report the presence of increased rough endoplasmic reticulum (RER) in addition to smooth endoplasmic reticulum (SER). In the centrilobular hepatocytes, there was substantial proliferation of rough endoplasmic reticulum, as shown by electron microscopy with slightly less than half of the periportal hepatocytes showing rough endoplasmic reticulum proliferation. Most authors associate microsomal hepatic enzyme induction with increases in smooth endoplasmic reticulum, however, this paper indicated both rough and smooth forms were affected in their model.
In addition to inducing P450 enzymes, phenobarbital can also induce glutathione S-transferase A1/A2 (rGSTA1/A2). Twelve hours after a single dose of phenobarbital, induction of rGSTA1/A2 as assessed by in situ hybridization was threefold higher in centrilobular versus periportal hepatocytes in rats (Selim et al. 2000). The half-life of rGSTA1/A2 was increased three-fold by Phenobarbital, and the higher centrilobular induction was attributed to localized stabilization of mRNA transcripts.
Other xenobiotics eliciting hepatic changes similar to phenobarbital in rodents include butylated hydroxytoluene (Crampton et al. 1977a), octamethylcyclotetrasiloxane (McKim et al. 2001), phenytoin, carbamazepine, dieldrin (Kolaja et al. 1996), and chlordane (Malarkey et al. 1995). Reversal of pleotrophic hepatic responses associated with enzyme induction has been documented following discontinuation of treatment. In the case of butylated hydroxytoluene, liver weight and enzyme activity returned to normal levels within thirty days of cessation of treatment (Crampton et al. 1977a). Increased liver weight, increased replicative DNA synthesis, and inhibition of gap-junction intercellular communication induced by a two-week treatment with diethlyhexyl phthalate or phenobarbital returned to control levels within one to four weeks following cessation of treatment (Isenberg et al. 2001). Reversal of hepatic proliferative focal lesion growth and even hepatocellular neoplasms has been reported following cessation of treatment with phenobarbital, dieldrin, and chlordane in these models (Kolaja et al. 1996; Malarkey et al. 1995).
Enzyme Induction Involving the Peroxisome Proliferator-activated Receptor
Peroxisome proliferator-activated receptors (PPAR) are members of the steroid hormone receptor superfamily (Peters et al. 1997), and PPAR-α is associated with pleotrophic responses in rodents, including liver enlargement. Peroxisome proliferator-activated receptor-α is highly expressed in rat and mouse liver, and there is less expression in guinea pigs, nonhuman primates, and humans (Cariello et al. 2005; Klaunig et al. 2003). Several xenobiotics induce PPAR activity, resulting in liver enlargement by stimulating the proliferation of hepatocyte peroxisomes and inducing the fatty acid oxidation enzyme CYP4A in rats and mice (Bentley et al. 1993; Stott 1988). Following activated PPAR binding to the RXR to form a heterodimer, there is binding to multiple specific response elements, leading to transcriptional activation of genes responsible for the pleotrophic effects of peroxisome proliferators (Green 1995; Yu et al. 2003).
As is the case with phenobarbitone-like enzyme induction, peroxisome proliferating compounds are associated with liver tumors in rats and mice following prolonged exposure (Greaves 2007; Peters et al. 1997). As non-genotoxic agents, peroxisome proliferators have demonstrated apparent thresholds for carcinogenesis under the experimental conditions studied (Bentley et al. 1993; Stott 1988). The mechanisms associated with hepatocarcinogenesis include production of reactive oxygen species; early, intermittent, or persistently enhanced cell proliferation and reduced apoptosis; promotion of spontaneously initiated hepatocytes; and combinations of one or more of these mechanisms (Grasso et al. 1991).
Peroxisome proliferator-activated receptor-α knockout mice do not develop hepatocellular neoplasia following long-term exposure to peroxisome proliferators (Lake 1995; Peters et al. 1997). Knockout mice expressing a human PPAR-α receptor developed fewer (5% vs. 71%) liver tumors than did wild-type mice exposed to a peroxisomal proliferator (Wy-14,643), suggesting carcinogenic response is a possible consequence of structural differences in human and mouse PPAR-α(Morimura et al. 2006).
There are important species and strain differences in sensitivity to peroxisome proliferators (O’Brien et al. 2005). In a comparative study of the herbicide oxadiazon, a xenobiotic with peroxisome proliferative activity but structurally distinct from other peroxisome proliferators, in Sprague-Dawley rats, CD1 mice, and Beagle dogs, treatment for fourteen (rats) or twenty-eight (mice and dogs) days produced liver enlargement in all three species (Richert et al. 2008). Although the magnitude of the change in absolute and/or relative liver weights was similar across species, morphological evidence of peroxisome proliferation based on transmission electron microscopy occurred only in rats and mice. Peroxisome proliferation was correlated with increased palmotyl CoA oxidase and acetyl carnitine transferase activities. Cultured rat hepatocytes also had elevated activities of these enzymes, whereas cultured human hepatocytes did not.
Enzyme Induction Involving the Ah Receptor
Halogenated aromatic hydrocarbons including polybrominated biphenyls, polychlorinated biphenyls, various dioxins including the potent 2,3,7,8-tetrachlorodibenzodioxin (TCDD), and dibenzylfurans, as well as the protypical inducer 3-methylcholanthrene, act by binding to the intracellular Ah receptor (AhR) (Carlson and Perdew 2002; Shimada et al. 2003; Whitlock 1993). This action results in multiple effects on the liver, including induction of CYP1A1, CYP1A2 and CYP1B1; hepatocyte hypertrophy; increased cellular replication along with decreased apoptosis; and liver enlargement. Many of the dioxins and other halogenated aromatic hydrocarbons are hepatocarcinogenic in rats.
Enzyme Induction Involving the Pregnane-X-receptor
Cyproterone acetate is a gestagen and antiandrogen that interacts with the nuclear pregnane-X-receptor (PXR) to bring about activation of several genes, including CYP3A. Liver enlargement is apparent after three days in rats (SchulteHermann and Parzefall 1980); DNA synthesis in periportal hepatocytes increased up to twenty-fold in twelve hours after commencement of treatment. The induction of liver growth is primarily by hepatocellular hyperplasia. Chronic treatment of rats results in liver tumors (Schulte-Hermann and Parzefall 1980; Schulte-Hermann, Hoffman, Parzefall et al. 1980; Schulte-Hermann, Hoffman, and Landgraf 1980). Spironolactone, pregnenolone 16a-carbonitrile, and other xenobiotics also act by binding PXR, with results similar to cyproterone acetate (Kliewer 2003; Schuetz et al. 1998; Schulte-Hermann and Parzefall 1980). In humans, CYP3A is readily induced by xenobiotics, is activated by CYP3A inducers, and leads to activation of PXR (Kliewer 2003; Schuetz et al. 1998).
In summary, liver enlargement can be the consequence of hepatocellular hypertrophy, hepatocellular hyperplasia, or both in response to enzyme induction. For example, α-hexachlorocyclohexane, phenobarbital, and 3-methylcholanthrene all increase liver size in rodents primarily owing to hypertrophy, in contrast to enzyme induction involving PXR mechanisms (Batt et al. 1992; Green 1995; Glaister 1986; Porter and Coon 1991; Schulte-Hermann 1974). However, xenobiotics that cause liver enlargement primarily by hepatocellular hypertrophy may also produce transient (phenobarbital-like xenobiotics) or sustained (WY-14,643) hepatocyte proliferation. It has also been shown that enzyme induction of phase II enzymes can lead to hepatomegaly without hepatocellular hypertrophy (Makino et al. 1998; Makino et al. 2008). Both tert-butylated hydroxyanisole (BHA) and 1,2-bis(2-pyridyl)ethylene (2PY-e) caused increased liver weight without any histopathological evidence of hepatocellular hypertrophy in rats (Makino et al. 1998).
Lobe and Lobular Zonation of Induced Enzymes
Several factors and conditions are associated with and influence hepatocyte enzyme induction. These factors include age, hormonal effects, diet, infection, and other environmental influences and may result in differential lobe and lobular effects on hepatocytes.
Published data on lobe differences in endogenous and induced enzymes is scarce, although many researchers suspect there may be important lobe differences based on differential blood flow (Wilson and Hiley 1983) and the observation of lobe differences in toxic responses. Using liver homogenates as the enzyme source, activity of cytochrome P450 in the rat was higher in the median and right lobes of the liver, and mitochondrial enzymes were higher in the left lobe (Matsubara et al. 1982). Even after phenobarbital treatment or after fasting, cytochrome P450 activity remained higher in the median and right lobes. In contrast, treatment with β-naphthoflavone resulted in a uniform increase in P450 throughout the liver. Interestingly, fasting for twenty-four hours resulted in marked decrease in glycogen content throughout the liver, with the most dramatic decrease occurring in the median and right lobes.
Zonation differences are associated with phase I and phase II metabolism enzymes, with a predominant centrilobular localization of most constitutively expressed P450s (Figure 1A and 1B) and other phase I enzymes and a predominant periportal expression of most phase II enzymes. Typical inducers of centrilobular CYP enzyme induction include phenobarbital, TCDD, 3-methylcholanthrene, ethanol, dexamethasone, and peroxisome proliferators (Lindros 1997). Following enzyme induction, the extent of lobular involvement increases to include mid-lobular and sometimes periportal hepatocytes (Figure 1C and 1D). However, phenobarbital and TCDD are also phase II enzyme inducers with induction of some glutathione transferases and UDP-glucuronyltransferases in centrilobular hepatocytes and predominant periportal expression of glutathione peroxidase (Lindros 1997). There is some evidence to suggest that zonation associated with P450 induction is modulated by circulating levels of growth hormone and thyroid hormones, whereas the zonation of constitutive P450 expression is governed by other factors (Lindros 1997; Tani et al. 2001).
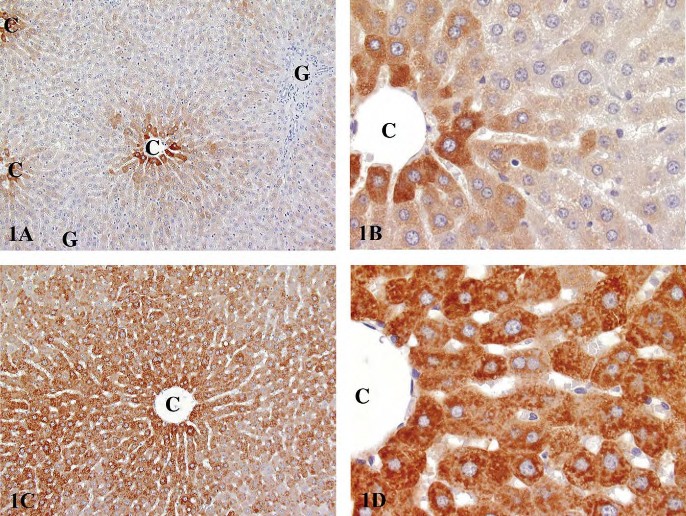
FIGURE 1.—Immunohistochemical staining for CYP3A1 in Fischer 344 rats. (A) Low magnification of constitutive expression involving centrilobular hepatocytes in a control rat. (B) Higher magnification of 1A. (C) Low magnification of enzyme induction following gavage exposure to kava kava extract for fourteen weeks. (D) Higher magnification of 1C. (Reproduced with permission of Elsevier from publication by Clayton et al. (2007). Exp Toxicol Pathol 58, 223-236.). C, central vein; G, Glison’s sheath.
Other factors that can also influence the zonal distribution of induced enzymes include age and sex, as well as different xenobiotics and the dosing regimen used.
The influence of age and sex on the distribution of induced enzymes was observed in a study of the lobular distribution of cytochrome P450a in Sprague-Dawley and Long-Evans rats (Moody et al. 1983). The lobular distribution of P450a staining by immunohistochemistry was identical between the two stocks. Baseline P450a fluorescence could be separated into two groups: (1) mature males, with fluorescence in centrilobular, midzonal and periportal regions; and (2) mature females and immature males and females, with fluorescence localized primarily to centrilobular hepatocytes. Following three days of daily injection of phenobarbital or 3-methylcholanthrene, the P450a fluorescence pattern did not change in mature males. However, in mature females and immature males and females, the intensity of fluorescence was increased and the distribution was similar to that of mature males. Additionally, a separate study of lobular distribution of hepatic P450 in SpragueDawley rats concluded that there were pronounced changes in hepatic lobular distribution of P450 enzymes from day 19 of gestation to forty-five days of age (Watanabe et al. 1993). From gestation day 19 to five days of age, P450 increased 1046% in periportal hepatocytes and 819% in centrilobular hepatocytes. The centrilobular content of P450 increased progressively between five and forty-five days of age, with the characteristic sublobular distribution favoring centrilobular hepatocytes first becoming apparent around seven days of age.
Endogenous substances (e.g., glucocorticoids) and exogenous substances (e.g., xenobiotics) can also cause enzyme induction. Following an intraperitoneal injection of 50 mg of hydrocortisone sodium succinate/kg body weight, hepatic induction of tyrosine transaminase was demonstrated in male Sprague-Dawley rats (Welsh 1972). Prior to treatment, tyrosine transaminase was distributed uniformly in the hepatic lobule. Four hours after treatment, there was a six-fold increase in periportal cells and a four-fold increase in centrilobular cells based on chemical quantitation. In the same study, glutamic pyruvate transaminase was five-fold higher in periportal hepatocytes versus centrilobular hepatocytes but increased in both areas of the lobule during a three-day fast. In a separate study, phenobarbital induced NADPHcytochrome c reductase, glutathione reductase, cytochrome P450, and UDP-glucuronosyltransferase equally in the centrilobular and periportal hepatocytes. In contrast, in untreated rats, higher activities of microsomal NADPH-cytochrome c reductase, 7-ethoxycoumarin o-deethylase, 7-ethoxyresorufin o-deethylase, and cytosolic glutathione transferase were found in the centrilobular hepatocytes (Bengtsson et al. 1987). The authors point out that, contrary to other published studies, the enzyme induction by phenobarbital in their study was panlobular. Further, a study was conducted to assess the effects of 3-methylcholanthrene, phenobarbital, and trans-stilbene oxide on epoxide hydrolase immunohistochemical staining. 3-Methylcholanthrene did not cause significant alterations in epoxide hydrolase immunohistochemical staining, but phenobarbital and trans-stilbene oxide produced significant alterations in the intensity and lobular pattern of distribution (Kawabata et al. 1983). Phenobarbital treatment produced increased staining in the mid-lobular regions seven days after treatment and increased staining in periportal as well as centrilobular hepatocytes. Trans-stilbene oxide increased staining up to 80% in both mid-lobular and periportal hepatocytes. These findings indicate that phenobarbital and trans-stilbene oxide both induce epoxide hydrolase non-uniformly within the hepatic lobule.
Lastly, the zonal distribution and intensity of immunopositivity for induced enzymes is also dependent on the specifics of the methodology used in the immunostaining procedures. For example, auto-induction of CYP2E1 can be demonstrated by immunostaining in rats and humans (Tsutsumi et al. 1989). It appears exclusively in the centrilobular hepatocytes at low antibody concentrations, but at higher antibody concentrations, panlobular immunostaining is observed. Immunohistochemical staining for epoxide hydrolase in Holtzman rats showed reactivity throughout the liver lobule, whereas microfluorometric determination of binding showed significantly more binding in centrilobular hepatocytes than the mid-lobular and periportal areas (Kawabata et al. 1981). The intralobular distributions were similar for male and female rats and similar within the right, median, left, and caudate lobes.
Species, Sex, and Strain Differences in Enzyme Induction
Specific differences in enzyme induction may confound predictions of xenobiotic metabolism between species, strains, and sexes. Animal liver and human liver have multiple forms of P450 that differ in content and proportions (Graham and Lake 2008; Matsubara et al. 1982). In humans, metabolism of many drugs is carried out by CYP3A, whereas in rats and dogs, CYP2C is a primary drug metabolism enzyme, as CYP3A levels in rats and dogs only reaches half the levels of their CYP2C activity.
Use of rat models to predict sex differences in human responses to xenobiotics is not reliable, since inter-individual variations among humans outweigh any sex-dependent responses. Additionally, sex-specific P450 isoforms have not been identified in humans. (Mugford and Kedderis 1998). In contrast, male-specific isoforms of P450 have been identified in the rat (Hanioka et al. 1998). Accordingly, sex-dependent differences in xenobiotic metabolism are well documented in rats, with greater responses generally seen in males (Mugford and Kedderis, 1998) and with responses influenced by circulating levels of growth hormone (Ahluwalia et al. 2004). Sex differences in enzyme induction are restricted primarily to rats, although sex differences were also observed for CYP2E1 in monkeys (Krueger 2005). Using marker substrates to identify induction of specific P450s, Kreuger and coworkers provided a summary of sex and species differences in the magnitude of CYP enzyme induction. A marked sex difference was observed in rats, with a ten-fold greater induction of CYP3A in females than in males and a four-fold greater induction of CYP4A in males than in females. The authors note that there is species specificity in the appropriate assays needed to identify some of the CYP enzymes. The species studied included Sprague-Dawley rats, CD-1 mice, Beagle dogs, and cynomologus monkeys treated withβ-naphthoflavone or phenobarbital (all species), isoniazid (rat), pyrasole (monkey), dexamethasone (rat, mouse, monkey), rifampin (dog), or clofibric acid (rat, mouse, dog). Details are provided for species and sex effects for CYP1A, 2B, 2E, 3A, and 4A.
Various authors have reported species and/or strain differences in enzyme induction as a result of xenobiotic administration. For example, an in vitro, cross-species assessment was conducted by Shimada and co-workers (Shimada et al. 1997). CYP-dependent drug oxidation activities were examined in liver microsomes of rats, guinea pigs, dogs, monkeys, and humans based on immunoblotting raised against human CYP1A2, 2A6, 2C9, 2E1, and 3A4; monkey 2B17; and rat 2D1. Monkeys have immunoproperties similar to those of humans, with catalytic activities generally greater in monkeys than humans. Dog, guinea pig, and rat CYP enzymes varied with the enzyme examined and were generally different from those in monkeys and humans. Intra-strain differences in enzyme induction were demonstrated by studying P450 enzyme induction and transitory hepatocyte cell proliferation in different mouse strains (Lin et al. 1989). Based on mouse strain differential susceptibility to phenobarbital promotion of DEN-initiated hepatocarcinogenesis, the authors compared the effects of phenobarbital in drinking water on hepatic microsomal protein concentrations in four strains of mice. Compared with untreated controls, microsomal protein concentrations were increased after twenty-eight days of treatment in C57BL mice, after four and twenty-eight days of treatment in C3H mice, after four days of treatment in B6C3F1 mice, and with no effect of treatment in C3B6F1 mice. However, after four and twenty-eight days of treatment, phenobarbital increased the concentrations of P450 in all four strains. Replicative DNA synthesis, as measured by tritiated thymidine, was elevated in all strains after four days of exposure to phenobarbital. After twenty-eight days of treatment, there was no difference in DNA synthesis in C3H and B6C3F1 mice and reduced DNA synthesis in C57BL and C3B6F1 mice. Further, in a comparison of levels of drug-metabolizing enzymes between transgenic or knockout mice and their parental strains using Western immunoblotting, increased expression of CYP2B and CYP3A isoforms was evident in XPA gene knockout mice with no differences from parental strains for rasH2, p53(+/-), and Tg.AC mice (Ariyoshi et al. 2001). Clofibrate-treated rasH2 mice had a similar increased content and activity of P450 as their wildtype littermates (Katsutani et al. 2000). Lastly, induction of CYP2B, 2C, and 3A was evaluated immunochemically by immunoblotting in male and female patas and cynomologus monkeys treated with phenobarbital (Jones and Lubet 1992). Induction was more pronounced in cynomologus than in patas monkeys, with no apparent sex difference and with a pattern of results that is consistent with that previously seen in rodents.
The examples cited in the above paragraphs are not intended to be exhaustive, as additional examples of species, strain, and sex differences in enzyme induction exist in the literature (reviewed in Graham and Lake 2008). Instead, they are illustrative examples of experimental data from in vivo and in vitro and rodent and nonrodent studies. As stated previously, these variables should be considered when interpreting data and/or considering cross-species, strain, or sex predictions of xenobiotic metabolism.
Xenobiotic-induced Liver Enlargement
The responses to P450 microsomal enzyme induction span a range from no apparent morphological change (Remmer 1964) to dramatic increase in liver size to frank hepatic toxicity and necrosis, with toxicity largely a consequence of the administered dose of the enzyme inducer. The various chemicals that induce liver enlargement associated with enzyme induction are presumed to be stimulating a hepatic physiological adaptation to an increased workload demand. The general characteristics of an adaptive liver enlargement response include dose dependency, a self-limiting response, and reversibility. An adaptive response typically will not have any evidence of pathological change in the liver.
The magnitude of the increase in liver size is dependent upon the specific xenobiotic, the magnitude of the dose, and the frequency of dosing. Athough increase in liver size as measured by liver weight is correlated with microsomal enzyme induction, neither the degree or extent of hypertrophy nor the magnitude of the weight increase is correlated with the magnitude of the enzyme induction in rats, dogs, or monkeys (Amacher et al. 1998; Amacher et al. 2001; Amacher et al. 2006). A 10% to 50% increase in liver weight is a typical response to xenobiotic exposure, but greater than 100% increases in liver weight have been documented (Amacher et al. 1998). Although repeated dosing will shift the liver size and cell content to a higher metabolic steady state, continued dosing does not stimulate further increase in liver size (Crampton et al. 1977a), and the response may actually decline slightly over time. Resolution of liver enlargement following cessation of treatment is influenced largely by the rate of elimination of the xenobiotic or its metabolite from the body. Rapidly cleared compounds result in restoration of liver weight to normal levels within a few days. Compounds that bioaccumulate in the body, such as dioxins, are associated with a prolonged period for restoration of normal liver weights.
Most xenobiotics associated with hepatic enzyme induction are bifunctional inducers of phase I and phase II enzymes, and effects are well studied. Phenobarbital is a prototypical example. Considerably less information is available on monofunctional inducers of phase II enzymes in the liver. Both tert-butylated hydroxyanisole and 1,2-bis(2-pyridyl)ethylene induce phase II enzymes without induction of phase I enzymes (Makino et al. 1998). These two compounds cause liver enlargement with relative liver weight increases up to 134% of control following treatment for seven days. In contrast to phenobarbital, however, neither centrilobular hypertrophy nor proliferation of smooth endoplasmic reticulum was evident in the enlarged livers (Makino et al. 1998; Makino et al. 2008). Although increased replicative DNA synthesis leading to increased numbers of hepatocytes can explain the liver enlargement induced by 1,2-bis(2-pyridyl)ethylene, an explanation for the liver enlargement induced by tert-butylated hydroxyanisole was not evident.
Increased liver weight with hepatocellular hypertrophy but without enzyme induction or ultrastructural changes other than glycogen accumulation has been reported in rats treated with D-tagatose (Bar et al. 1999; Kruger et al. 1999). In aging rats, absolute liver weights and liver weight to brain weight ratios are increased without apparent effects on enzyme induction (Irisarri and Hollander 1994).
Hepatocellular Hypertrophy
Hypertrophy is an increase in size of an organ or individual cell that may occur for many reasons. Hepatocellular hypertrophy (synonym = hepatocytomegaly) refers to an increased size of hepatocytes (total hepatocyte size, including nucleus and cytoplasm), but not an increased number of hepatocytes. Hepatocellular hypertrophy is typically identified by light microscopy and is associated with increased protein synthesis (assessed biochemically) and increased cytoplasmic organelles such as endoplasmic reticulum and peroxisomes (assessed by electron microscopy), or accumulation of intracellular components such as glycogen, lipid, or water. Hepatocellular hypertrophy is considered a hallmark of enzyme induction when there is an increased protein synthesis or increased number of cytoplasmic organelles. As a generalization, phenobarbitaltype inducers tend to more readily lead to increases in liver weight and cause hepatocellular hypertrophy because of the increase in smooth endoplasmic reticulum. In contrast, 3-methylcholanthrene–type inducers have less of a tendency to increase liver weight and do not appreciably increase smooth endoplasmic reticulum. Polycyclic aromatic hydrocarbons such as 3-methylcholanthrene act via the Ah receptor to induce gene expression.
Following xenobiotic exposure, enzyme induction and its associated hepatocellular hypertrophy are not usually immediately apparent, with a maximal response occurring a few days to a week or more after exposure, since the enzyme inducer must first reach steady state, and new drug-metabolizing enzymes need to be synthesized. Similarly, once the inducing agent is removed, the effects on hepatocytes may take a few weeks to resolve (time for the xenobiotic to be cleared and for enzymes to degrade). Increased liver weight following two weeks of phenobarbital treatment returns to control levels within two to four weeks following cessation of treatment in rodents (Isenberg et al. 2001).
For P450 enzyme inducers, hepatocellular hypertrophy is typically characterized ultrastructurally by proliferation of smooth endoplasmic reticulum (Figure 2) that on HandEstained light microscopy sections is manifested as enlarged hepatocytes with finely granular or ‘‘ground glass’’ eosinophilic cytoplasm (Figure 3). Depending on the extent of hypertrophy, eosinophilic cytoplasmic inclusions that represent concentric arrays of smooth endoplasmic reticulum may be seen (Greaves 2007). Similar cytoplasmic inclusions induced by phenobarbital have been reported in dogs (Ito et al. 1998). The lobular distribution of hypertrophic hepatocytes is classically considered to be centrilobular (Figure 3) for many microsomal enzyme inducers. However, distinctly different lobular patterns of hypertrophy can be seen for certain xenobiotics. Furthermore, the lobular distribution is dependent on dose with higher doses tending to produce centrilobular plus mid-lobular (Figure 4) and even panlobular hepatocellular hypertrophy. The different location of the hypertrophic response may be correlated with differences in hepatic enzyme distribution, blood flow, and metabolic activation of chemicals within the hepatic acinus. When the hypertrophy is mild and diffuse, involving all acinar zones, the detection of this change by light microscopy may be difficult; liver weight should be helpful for this determination. Marked centrilobular hepatocyte hypertrophy with attendant karyomegaly and multinucleated giant hepatocytes has been reported in chlordaneexposed mice (Malarkey et al. 1995) (Figure 5).
Subtle differences in the morphological appearance of smooth endoplasmic reticulum are sometimes seen. Rifampicin induces proliferation of smooth endoplasmic reticulum in both humans and guinea pigs, but there is a difference in the pattern of proliferation (Jezequel et al. 1971). In the guinea pig, the increased smooth endoplasmic reticulum is in limited areas of the cytoplasm and has a uniform, small-tubular form. In humans, large vesicles of smooth endoplasmic reticulum are interspersed with small islets of small vesicles and densely packed tubules. The authors point out that despite these differences, the pattern of smooth endoplasmic reticulum in humans is more similar to that of the guinea pig than it is to rats and dogs. A more detailed morphometric study of endoplasmic reticulum in humans is available (Jezequel et al. 1974). In a review of Danish epilepsy patients exposed to phenobarbital for eight to forty-eight years, the primary liver effect was cholestasis, but enzyme induction as reflected by hepatocellular hypertrophy was not obvious (Ward et al. 1989). It is noteworthy that clear cell foci of cellular alteration were noted in the livers of these Danish epilepsy patients.
Although some xenobiotics such as phenobarbital are associated with hepatocellular hypertrophy throughout a long-term administration, the initial hypertrophy associated with other xenobiotics such as safrole and Ponceau is not sustained (Crampton et al. 1977b). Upon cessation of treatment and clearance from the body for many xenobiotics that produce hepatocellular hypertrophy, the excess smooth endoplasmic reticulum is removed, presumably by autophagic sequestration (Feldman et al. 1980).
Proliferation of peroxisomes (microbodies) can be induced in the rodent liver by a variety of chemicals including hypolipidemic agents, herbicides, plasticizers, and chlorinated hydrocarbons (Cattley et al. 1998; DeAngelo et al. 1989; Greaves 2007). This class of chemicals probably causes the largest non-neoplastic increase in liver weights of rodents, often up to 10% of the body weight. Hepatocellular hypertrophy associated with peroxisome proliferators is characterized ultrastructurally by up to a twenty-fold increased number of peroxisomes in the hepatocyte cytoplasm (Evans and Lake 1998) (Figure 6). In HandE-stained light microscopic sections the enlarged cytoplasm is eosinophilic and granular, with the granularity typically more pronounced than what is seen in livers with peroxisomal enzyme induction (Figure 7). Catalase activity, which can be readily demonstrated in normal liver, is markedly increased in hypertrophic hepatocytes induced by peroxisome proliferators (Greaves 2007). These morphological changes are accompanied by induction of fatty acid metabolizing enzymes (e.g., acyl CoA) and cytochrome P450 CYP4A. In general, the mouse appears to be more sensitive than the rat with respect to the enhancement of liver peroxisome proliferation. Chronic exposure to peroxisome proliferators in rodents leads to deposition of lipofuscin and eventually to liver tumors, most probably a consequence of oxidative stress leading to DNA damage (Evans and Lake 1998). In addition to proliferation of peroxisomes, in cynomologus monkeys, fibrate-induced liver changes are associated with an increase in the number of mitochondria, which parallels the magnitude of the increase in peroxisomes (Cariello et al. 2005; Hoivik et al. 2004).
FIGURE 2.—Ultrastructural features of control (top) and treated (bottom) rats treated per os for two weeks with a COX inhibitor. There is a dramatic increase in smooth endoplasmic reticulum in the treated rat. Inserts show a higher magnification of the cytosol immediately adjacent to the nucleus. Figures provided courtesy of Dr. Katsuhiko Yoshizawa.
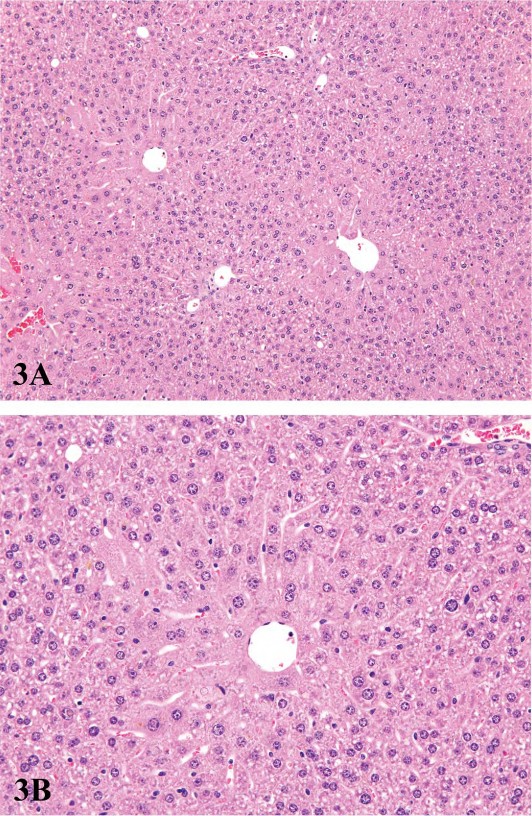
FIGURE 3.—Low (A) and high (B) magnification of centrilobular hepatocyte hypertrophy in a male B6C3F1 mouse treated with pulegone. The enlarged hepatocytes around the central veins have finely granular eosinophilic cytoplasm. Figures courtesy of the National Toxicology Program.
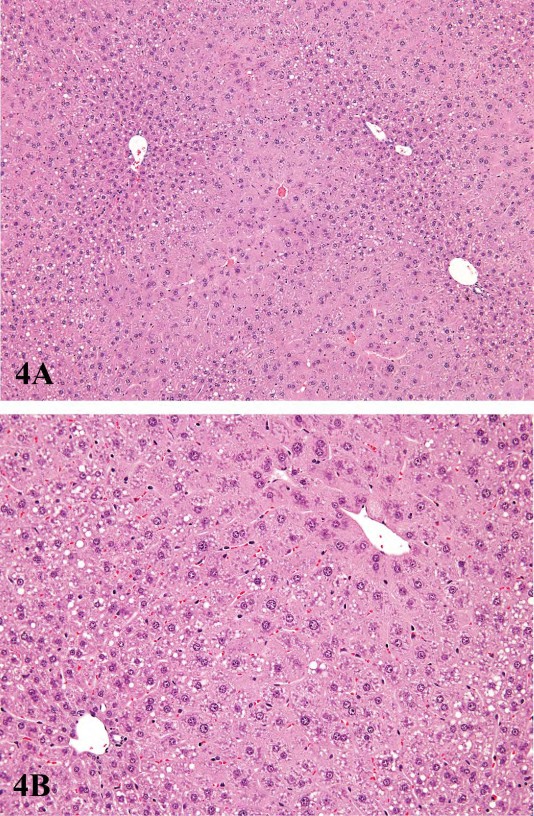
FIGURE 4.—Low (A) and high (B) magnification of centrilobular hypertrophy extending from the centrilobular to the midlobular areas. Liver is from a male B6C3F1 mouse treated with pentabromodiphenyl oxide. Figures courtesy of the National Toxicology Program.
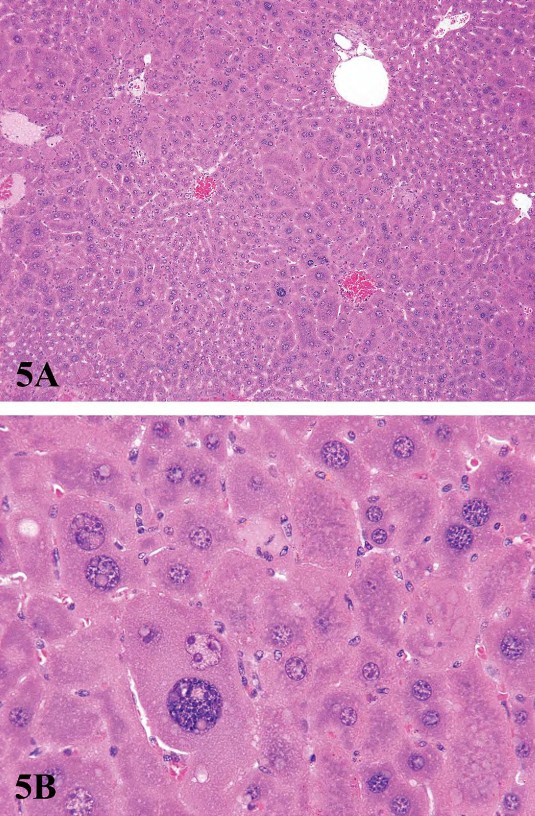
FIGURE 5.—Low (A) and high (B) magnification of dramatic hepatocellular hypertrophy in a male B6C3F1 mouse following chronic exposure to chlordane. Centrilobular enlarged hepatocytes with karyomegaly and multiple nuclei are present. Figure courtesy of the National Toxicology Program.
FIGURE 6.—Ultrastructural features of a control (A) and a treated (B) rat showing an increase in catalase-positive peroxisomes following treatment with a phenoxyherbicide. DAB incubation. Figures provided courtesy of Dr. Wolfgang Kaufmann
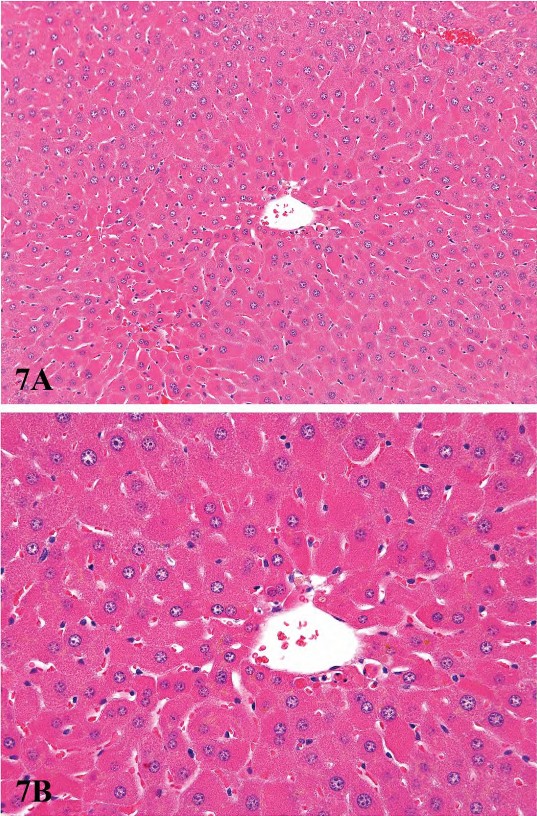
FIGURE 7.—Low (A) and high (B) magnification of diffuse peroxisomal proliferation in a B6C3F1 male mouse liver. Mouse was treated for six months with 8,000 ppm gemfibrizol. Note marked eosinophilia of hepatocyte cytoplasm. Figures provided courtesy of the National Toxicology Program
Hepatocellular Hyperplasia
Some degree of hyperplasia almost always accompanies enzyme-induced adaptive hypertrophy in the rodent liver, but it may be short lived rather than chronic. Hyperplasia contributes to increased liver size and functional capacity by increasing cell numbers. Hepatocellular hypertrophy and hyperplasia often occur together in response to enzyme inducers, and the histologic diagnosis is often based on the relative predominance of the two. Hypertrophy is more readily apparent owing to its focal and lobular localized occurrence. For most enzyme inducers, hyperplasia is transient and may require specific DNA labeling studies or immunohistochemical stains to clearly identify its occurrence. In rodents, especially mice, the increased DNA content that represents the biochemical effect of hyperplasia may occur by changes in cellular ploidy without actual cytokinesis.
The contribution of hyperplasia to liver enlargement in xenobiotic-exposed rodents comes about in two ways. Initially following exposure to a xenobiotic inducer, periportal hyperplasia occurs as an early response, evident before there is obvious centrilobular hepatocellular hypertrophy. A second mechanism leading to hepatocellular hyperplasia is a consequence of shifts of existing hepatocyte populations from binucleated hepatocytes to mononucleated cells and shifts from a mononucleated tetraploid hepatocyte to two diploid hepatocytes (cytokinesis without nuclear duplication). The relative contribution of each of these ploidy shifts is influenced by the age-related ploidy status of the rodent liver (Golberg 1966; SchulteHermann 1979; Schulte-Hermann 1974; Styles et al. 1987; Styles 1993a; Styles 1993b). Some of the prototypical enzyme inducers cause an initial and transitory mitogenic response that increases the number of hepatocytes in the affected liver (Bentley et al. 1993; Crampton et al. 1977a; Schulte-Hermann 1974). The increased number of hepatocytes resulting from the hyperplastic response is generally believed to remain at the elevated level, having established a new set point of adaptive function, until the xenobiotics stimulus is removed.
Liver Enlargement and Hepatotoxicity
Both enzyme induction and proliferation of endoplasmic reticulum are responses that enhance metabolism and detoxification. There are, however, instances in which the enhanced metabolism may generate metabolites that are directly (or indirectly) hepatotoxic or toxic to other organs (e.g., metabolism of chloroform to form phosgene; thyroid hyperplasia following increased hepatic metabolism of thyroid hormone).
When liver enlargement secondary to enzyme induction exceeds an adaptive response, there is hepatotoxicity. Both the dose and the duration of xenobiotic exposure will influence the type and degree of toxicity, and there is often preferential susceptibility to the toxicity based on the intralobular location of hepatocytes. Hepatic effects that are considered adverse include death, abnormal clinical chemistry parameters, obvious functional organ impairment, DNA and mitochondrial alteration, glutathione depletion, hepatocyte necrosis, enhanced replicative DNA synthesis, generation of reactive oxygen species, and increased peroxisome proliferation (in rodents) (Williams and Iatropoulos 2002). Histological evidence of toxicity includes fatty change and hepatocellular degeneration and necrosis (Figure 8). For some xenobiotics, the toxicity may involve biliary and oval cells (Figure 9), produce cholestasis, or be associated with vascular occlusive changes and granulomatous inflammation. Proposed mechanisms for hepatocyte necrosis include extreme hypertrophy leading to reduced sinusoidal blood circulation, hypoxia, and necrosis (Slauson and Cooper 2001) and/or metabolic activation forming more toxic active metabolites (Farber 1980).
The intralobular zonation of drug-induced metabolizing enzymes is clearly associated with patterns of toxicity. The majority of hepatotoxins damage centrilobular hepatocytes, most probably as a result of oxidative activation to electrophilic intermediates by the CYP isoforms located in the centrilobular region (Lindros 1997). For example, the ethanol-inducible CYP2E1, which is located in the centrilobular hepatocytes, effectively catalyzes the centrilobular hepatotoxicity of acetaminophen, carbon tetrachloride, benzene, and nitrosamines. However, whereas the majority of hepatotoxic compounds cause centrilobular injury, some xenobiotics, such as allyl formage, elemental phosphorus, and allyl alcohol, preferentially damage periportal hepatocytes, presumably as a result of rapid first-pass uptake by these upstream hepatocytes. Allyl alcohol is rapidly metabolized by alcohol dehydrogenase to acrolein, which damages periportal cells once glutathione levels are depleted. This first-pass mechanism of periportal toxicity for selected compounds, including hepatotoxicants that primarily affect centrilobular hepatocytes, could result from deficient cytoprotective capacity secondary to depletion of phase II conjugating enzymes in addition to being a consequence of a higher exposure gradient to these upstream hepatocytes. Although mid-zonal necrosis is not commonly seen, it has been reported for the phytotoxin ngaione and for ferrous sulphate (Evans and Lake 1998).
For hepatotoxic xenobiotics that directly affect the liver and produce hepatocellular necrosis, evidence of necrosis is usually apparent within forty-eight hours or earlier. The initial insult can be followed by a regenerative hyperplastic response. If the cycle of necrosis and regeneration continues, there will be liver enlargement. Hepatotoxic chemicals do not necessarily cause enzyme induction. The histomorphological changes in hepatotoxic liver enlargement without enzyme induction include fluid accumulation, fatty change in hepatocytes, inflammatory cell infiltration, fibrosis, and possibly granuloma formation (Glaister 1986; Evans and Lake, 1998). Prolonged hepatotoxicity with associated regenerative hyperplasia can be associated with and lead to liver tumor development (Evans and Lake 1998; Greaves 2007).
Some xenobiotics associated with hepatotoxicity produce liver enlargement as a consequence of specific effects that may not necessarily involve microsomal enzyme induction. For example, methapyriline increases liver weight and the number of hepatocyte mitochondria in treated mice, with development of hepatotoxicity and liver neoplasia probably secondary to oxidative damage (Powell et al. 1994; Resnik-Schuller and Lijinsky 1982). The coloring agent Ponceau increases liver weight in rats as a result of hepatocellular hypertrophy and hyperplasia (Glaister 1986); enlarged lysosomes, an initial elevation of mixed function oxidase activity, and ultimately development of hepatocellular neoplasia can be seen. Liver enlargement may also occur secondarily to exposure to hemolytic or nephrotoxic xenobiotics (Glaister 1986; Evans and Lake 1998). Phenylhydrazine-induced hemolysis leads to proliferation of hepatic reticuloendothelial cells and liver enlargement. Aminonucleosides can cause kidney damage, with resulting loss of serum protein leading to an increased functional demand on the liver and resulting liver enlargement (Evans and Lake 1998).
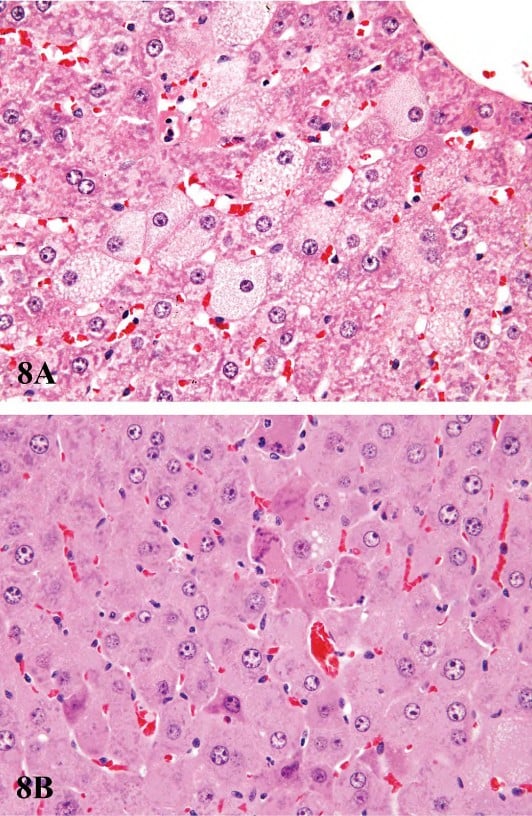
FIGURE 8.—Examples of acute hepatotoxicity associated with prolonged or exaggerated enzyme induction. (A) Centrilobular hypertrophy and microvesicular fatty change in hepatocytes from a male F344 rat treated for ninety days with 100 mg/kg pentabromodiphenyl oxide. (B) Centrilobular hypertrophy showing individual cell necrosis of hepatocytes from a male B6C3F1 mouse treated for ninety days with 500 mg/kg pentabromodiphenyl oxide. Figures provided courtesy of the National Toxicology Program.
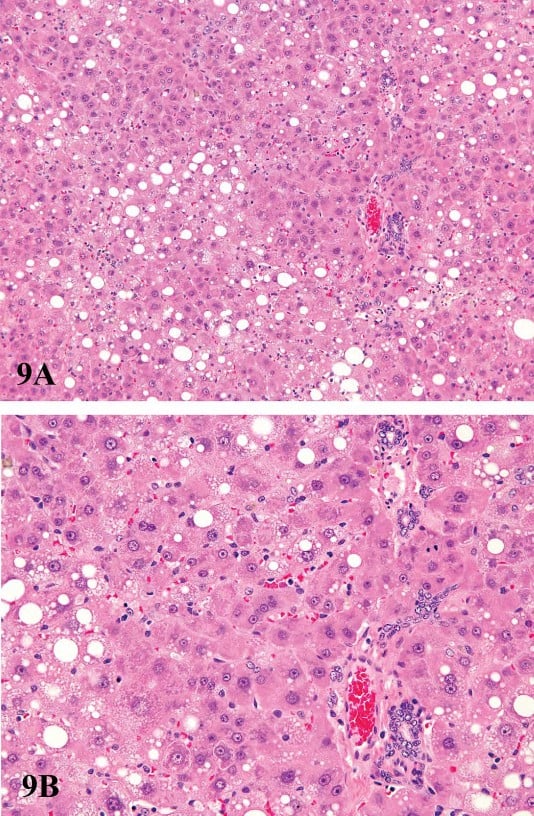
FIGURE 9.—Low (A) and high (B) magnification of hepatotoxicity associated with prolonged or exaggerated enzyme induction. Centrilobular hypertrophy and mid-zonal cytoplasmic vacuolization of hepatocytes from a male F344 rat treated for ninety days with 100 mg/kg pentabromodiphenyl oxide. There is oval cell proliferation and bile duct proliferation present in portal areas. Figures provided courtesy of the National Toxicology Program.
Liver Enlargement and Hepatocarcinogenicity
The relationships of liver enlargement/enzyme induction to toxicity and cancer is complex. The set point between an adaptive response to enzyme induction and a response that ultimately leads to cancer has no universal parameters, as it is influenced by differential species susceptibility, the dose and duration of xenobiotic exposure, and the age and sex of the exposed species or strain, and whether or not the xenobiotic is also mitogenic.
When administered for long periods, several well-known hepatic enzyme inducers are associated with development of liver neoplasia (Butler 1996; Peters et al. 1997; SchulteHermann and Parzefall 1980; Schulte-Hermann, Hoffman, Parzefall et al. 1980; Schulte-Hermann, Hoffman, and Landgraf 1980; Schuetz et al. 1998). Most of these hepatic enzyme inducers are rodent hepatocarcinogens only at doses that far exceed human exposure levels. A commonly invoked mechanism for liver neoplasia involves prolonged hepatocellular hyperplasia, although not all xenobiotics are associated with prolonged enhanced DNA replication. For example, the hepatocarcinogenicity of diethylhexyl phthalate, phenobarbital, paracetamol, and 1,4-dichlorobenzene is not directly correlated with persistent DNA replication (Schulte-Hermann 1974; Styles 1993a; Styles 1993b). Other chronic toxic lesions in the liver are often associated or not associated with liver carcinogenesis in rodents (Hoel et al. 1988; Ward 1980).
The induction of murine liver carcinogenesis secondary to phenobarbital enzyme induction shows considerable strain susceptibility and is causally associated with activation of the CAR receptor. Highly susceptible Car -/- C3H male mice initiated with diethylnitrosamine and promoted with phenobarbital do not develop liver tumors (Yamamoto et al. 2004). In a comparison of susceptible and resistant mice, Wastl and coworkers (Wastl et al. 1998) analyzed CYP2A5 expression in C3H, C57BL/6, and B6C3F1 mice and found expression in phenobarbital promoted preneoplastic and neoplastic liver lesions in all three strains. As expected, fewer foci and tumors were seen in the C57BL/6 mice. Treatment of F344 rats and B6C3F1 and Swiss mice with oxazepam caused hepatocellular centrilobular hypertrophy in both species, but rats did not develop liver tumors, whereas the mice developed hepatocellular neoplasms as well as hepatoblastomas (Bucher et al. 1998; NTP 1993). Liver enlargement in rodents attributable to nongenotoxic microsomal enzyme induction that is greater than 140% has been reported to lead to liver tumor development in male C57BL/10J mice (Greaves 1996).
In a retrospective examination of data from 138 carcinogenicity studies in mice, increased liver weight at twelve months was typically associated with development of liver tumor by eighteen to twenty-four months (Carmichael et al. 1997). An increased liver weight of 110% at one year was not associated with liver tumorigenesis, whereas liver tumorigenicity was seen if the one-year liver weight was 150% of control values (Carmichael et al. 1997). A similar correlation between liver weight at fifty-two weeks and ultimate hepatocarcinogenicity in mice was reported by scientists at the NTP (Haseman et al. 1997). In a retrospective analysis of ninety-day toxicity study data from eighty-three mouse studies and eighty-seven rat studies that were also tested for carcinogenicity, the combined presence of hepatocellular necrosis, hepatocellular hypertrophy, hepatocellular cytomegaly, bile duct hyperplasia, and hepatocellular degeneration, along with increased liver weight, was significantly predictive of hepatocarcinogenicity in the two-year study (Allen et al. 2004). Increased liver weight at ninety days was an important contributor to the positive correlation.
Organochlorine insecticides have been shown to be murine hepatocarcinogens. The dramatic centilobular hypertrophy associated with treatment may be characterized by giant multinucleated hepatocytes, such as occurs with dieldrin and chlordane (Malarkey et al. 1995; Stevenson et al. 1995). It is of some interest that liver tumors in chlordane-treated mice, including some hepatocellular carcinomas, were shown to regress upon cessation of treatment, suggesting that their tumor response was conditional upon continued exposure to chlordane (Malarkey et al. 1995).
The hepatocarcinogenicity of peroxisome proliferators in rodents involves several members of this heterogeneous group of agents (Evans and Lake 1998). Among these agents are phthalates and hypolipidemic agents, as well as the prototypical positive control chemical WY-14,643. With the exception of WY-14,643, these agents produce a transient hyperplasia with subsequent hepatocellular hypertrophy. Proliferation of peroxisomes can account for up to 20% increase in hepatocytes volume with a twenty- to thirty-fold increase in fatty acid β-oxidation. Induction of peroxisomes involves the PPAR, a member of the superfamily of steroid hormone receptors. Prolonged administration of peroxisome proliferators to rats and mice results in development of basophilic foci and subsequent development of hepatocellular carcinomas. Peroxisome proliferator-activated receptor–null mice exposed to peroxisome proliferators do not develop hepatocellular neoplasia (Peters et al. 1997), and mice with a humanized PPAR-α receptor have a markedly reduced incidence of liver tumors compared with wild-type littermates (Morimura et al. 2006). In contrast to spontaneous hepatocellular foci of alteration and neoplasms, foci and tumors induced by peroxisome proliferators are negative for γ-glutamyl transpeptidase and placental glutathione-S transferase (Evans and Lake 1998). A combination of prolonged oxidative damage and hepatocellular proliferation is postulated to be responsible for liver tumor development, with tumor development primarily a result of enhanced growth of preneoplastic foci.
Conclusions
As a best case scenario, histological evidence of hypertrophy has been associated with increases of 20% or more in absolute liver weight (Amacher et al. 1998). This finding is best appreciated when there is a distinct lobular distribution of the hepatocellular hypertrophy. Neither the magnitude of the liver weight increases nor the degree and extent of hypertrophy are positively correlated with the magnitude of the enzyme induction (Amacher et al. 1998; Amacher et al. 2001; Amacher et al. 2006). It is generally agreed that hepatocellular hypertrophy may be an important qualitative metric, but grading the severity of hypertrophy is less precise than relying on liver weight or quantitative measurement of enzyme induction. Important relationships and correlations of hypertrophy, enzyme induction, and liver weight with clinical pathology measurements are described (Ennulat et al. 2010). In cases where there is considerable increase in liver size, subcapsular hepatocellular necrosis can be due to the mechanical effects of compression (Parker and Gibson 1995).
Morphological features of hepatic enzyme induction range from adaptive physiological responses characterized by liver weight increases with or without hepatocellular hypertrophy to adverse pathological effects including toxicity and carcinogenicity. The morphological responses can be assessed by light and electron microscopy and immunohistochemistry and should be interpreted in conjunction with clinical pathology alterations (Ennulat et al. 2010) to determine when an adaptive response becomes adverse. Ultimately, the responses to enzyme induction will need to be interpreted with respect to potential consequences for human health (Francke-Carroll et al. 2010).
References
Ahluwalia, A., Clodfelter, K. H., and Waxman, D. J. (2004). Sexual dimorphism of rat liver gene expression: Regulatory role of growth hormone revealed by deoxyribonucleic acid microarray analysis. Mol Endocrinol 18, 747–60.
Allen, D. G., Pearse, G., Haseman, J. K., and Maronpot, R. R. (2004). Prediction of rodent carcinogenesis: An evaluation of prechronic liver lesions as forecasters of liver tumors in NTP carcinogenicity studies. Toxicol Pathol 32, 393–401.
Amacher, D. E., Schomaker, S. J., Boldt, S. E., and Mirsky, M. (2006). The relationship among microsomal enzyme induction, liver weight, and histological change in cynomolgus monkey toxicology studies. Food Chem Toxicol 44, 528–37.
Amacher, D. E., Schomaker, S. J., and Burkhardt, J. E. (1998). The relationship among microsomal enzyme induction, liver weight and histological change in rat toxicology studies. Food Chem Toxicol 36, 831–39.
Amacher, D. E., Schomaker, S. J., and Burkhardt, J. E. (2001). The relationship among microsomal enzyme induction, liver weight and histological change in beagle dog toxicology studies. Food Chem Toxicol 39, 817–25.
Ariyoshi, N., Imaoka, S., Nakayama, K., Takahashi, Y., Fujita, K., Funae, Y., and Kamataki, T. (2001). Comparison of the levels of enzymes involved in drug metabolism between transgenic or gene-knockout and the parental mice. Toxicol Pathol 29 Suppl, 161–72.
Bar, A., Lina, B. A., de Groot, D. M., de Bie, B., and Appel, M. J. (1999). Effect of d-tagatose on liver weight and glycogen content of rats. Regul Toxicol Pharmacol 29, S11–28.
Batt, A. M., Siest, G., Magdalou, J., and Galteau, M. M. (1992). Enzyme induction by drugs and toxins. Clin Chim Acta 209, 109–21.
Bengtsson, G., Julkunen, A., Penttila, K. E., and Lindros, K. O. (1987). Effect of phenobarbital on the distribution of drug metabolizing enzymes between periportal and perivenous rat hepatocytes prepared by digitonin-collagenase liver perfusion. J Pharmacol Exp Ther 240, 663–67.
Bentley, P., Calder, I., Elcombe, C., Grasso, P., Stringer, D., and Wiegand, H. J. (1993). Hepatic peroxisome proliferation in rodents and its significance for humans. Food Chem Toxicol 31, 857–907.
Botts, S., Ennulat, D., Francke-Carrol, S., Graham, M. and Maronpot, R. R. (2010). Introduction to hepatic drug metabolizing encyme induction in nonclincical toxicity studies. Toxicol Pathol (submitted as companion paper).
Bucher, J. R., Haseman, J. K., Herbert, R. A., Hejtmancik, M., and Ryan, M. J. (1998). Toxicity and carcinogenicity studies of oxazepam in the Fischer 344 rat. Toxicol Sci 42, 1–12.
Butler, W. H. (1996). A review of the hepatic tumors related to mixed-function oxidase induction in the mouse. Toxicol Pathol 24, 484–92.
Cariello, N. F., Romach, E. H., Colton, H. M., Ni, H., Yoon, L., Falls, J. G., Casey, W., Creech, D., Anderson, S. P., Benavides, G. R., Hoivik, D. J., Brown, R., and Miller, R. T. (2005). Gene expression profiling of the ppar-alpha agonist ciprofibrate in the cynomolgus monkey liver. Toxicol Sci 88, 250–64.
Carlson, D. B., and Perdew, G. H. (2002). A dynamic role for the Ah receptor in cell signaling? Insights from a diverse group of ah receptor interacting proteins. J Biochem Mol Toxicol 16, 317–25.
Carmichael, N. G., Enzmann, H., Pate, I., and Waechter, F. (1997). The significance of mouse liver tumor formation for carcinogenic risk assessment: Results and conclusions from a survey of ten years of testing by the agrochemical industry. Environ Health Perspect 105, 1196–203.
Cattley, R. C., DeLuca, J., Elcombe, C., Fenner-Crisp, P., Lake, B. G., Marsman, D. S., Pastoor, T. A., Popp, J. A., Robinson, D. E., Schwetz, B., Tugwood, J., and Wahli, W. (1998). Do peroxisome proliferating compounds pose a hepatocarcinogenic hazard to humans? Regul Toxicol Pharmacol 27, 47–60.
Crampton, R. F., Gray, T. J., Grasso, P., and Parke, D. V. (1977a). Longterm studies on chemically induced liver enlargement in the rat. I. Sustained induction of microsomal enzymes with absence of liver damage on feeding phenobarbitone or butylated hydroxytoluene. Toxicology 7, 289–306.
Crampton, R. F., Gray, T. J., Grasso, P., and Parke, D. V. (1977b). Long-term studies on chemically induced liver enlargement in the rat. Ii. Transient induction of microsomal enzymes leading to liver damage and nodular hyperplasia produced by safrole and ponceau mx. Toxicology 7, 307–26.
DeAngelo, A. B., Daniel, F. B., McMillan, L., Wernsing, P., and Savage, R. E., Jr. (1989). Species and strain sensitivity to the induction of peroxisome proliferation by chloroacetic acids. Toxicol Appl Pharmacol 101, 285–98.
Ennulat, D., Walker, D., Boone, L., Clemo, F., Magid-Slav, M., Ledieu, D., Graham, K. and Botts, S. (2010). Effects of hepatic drug megtaboliing enzyme induction on clinical pathology parameters in animals and man. Toxicol Pathol (submitted as companion paper).
Evans, J., and Lake, B. (1998). The digestive system ii: The hepatobiliary system. In Target organ pathology. A basic text. (J. Turton and J. Hooson, eds.), pp. 61–97. Taylor and Francis, London.
Farber, E. (1980). Toxicological significance of liver hypertrophy produced by inducers of drug-metabolizing enzymes. Ciba Found Symp 76, 261–74.
Feldman, D., Swarm, R. L., and Becker, J. (1980). Elimination of excess smooth endoplasmic reticulum after phenobarbital administration. J Histochem Cytochem 28, 997–1006.
Francke-Carroll, S., Mohutsky, M.A., Romeike, A., Lee, W.M. and Fowler, J. (2010). Hepatic drug metabolizing enzyme induction and implications for preclinical and clinical risk assessment. Toxicol Pathol (submitted as companion paper).
Glaister, J. (1986). Principles of Toxicologic Pathology. pp. 223. Taylor and Francis, London.
Goldberg, L. (1966). Liver enlargement produced by drugs: Its significance. Proceedings of the European Society for the Study of Drug Toxicity 7, 171–84.
Graham, R. A., Downey, A., Mudra, D., Krueger, L., Carroll, K., Chengelis, C., Madan, A., and Parkinson, A. (2002). In vivo and in vitro induction of cytochrome p450 enzymes in beagle dogs. Drug Metab Dispos 30, 1206–13.
Graham, M. J., and Lake, B. G. (2008). Induction of drug metabolism: species differences and toxicological relevance. Toxicology 254, 184–91.
Grasso, P., Sharratt, M., and Cohen, A. J. (1991). Role of persistent, non-genotoxic tissue damage in rodent cancer and relevance to humans. Annu Rev Pharmacol Toxicol 31, 253–87.
Greaves, P. (1996). The evaluation of potential human carcinogens: A histopathologist’s point of view. Exp Toxicol Pathol 48, 169–74.
Greaves, P. (2000). Histopathology of Preclinical Toxicity Studies. Interpretation and Relevance in Drug Safety Evaluation. Elsevier, London, UK.
Green, S. (1995). PPAR: A mediator of peroxisome proliferator action. Mutat Res 333, 101–9.
Hanioka, N., Jinno, H., Nishimura, T., and Ando, M. (1998). Suppression of male-specific cytochrome P450 isoforms by bisphenol A in rat liver. Arch Toxicol 72, 387–94.
Haseman, J. K., Young, E., Eustis, S. L., and Hailey, J. R. (1997). Body weighttumor incidence correlations in long-term rodent carcinogenicity studies. Toxicol Pathol 25, 256–63.
Hoel, D. G., Haseman, J. K., Hogan, M. D., Huff, J., and McConnell, E. E. (1988). The impact of toxicity on carcinogenicity studies: implications for risk assessment. Carcinogenesis 9, 2045–52.
Hoivik, D. J., Qualls, C. W., Jr., Mirabile, R. C., Cariello, N. F., Kimbrough, C. L., Colton, H. M., Anderson, S. P., Santostefano, M. J., Morgan, R. J., Dahl, R. R., Brown, A. R., Zhao, Z., Mudd, P. N., Jr., Oliver, W. B., Jr., Brown, H. R., and Miller, R. T. (2004). Fibrates induce hepatic peroxisome and mitochondrial proliferation without overt evidence of cellular proliferation and oxidative stress in cynomolgus monkeys. Carcinogenesis 25, 1757–69.
Holsapple, M. P., Pitot, H. C., Cohen, S. M., Boobis, A. R., Klaunig, J. E., Pastoor, T., Dellarco, V. L., and Dragan, Y. P. (2006). Mode of action in relevance of rodent liver tumors to human cancer risk. Toxicol Sci 89, 51–56.
Irisarri, E., and Hollander, C. (1994). Aging of the liver. In Pathobiology of the Aging Rat (U. Mohr, D. Dungworth, and C. Capen, eds.). ILSI Press, Washington, DC; pp. 341–49.
Isenberg, J. S., Kamendulis, L. M., Ackley, D. C., Smith, J. H., Pugh, G., Jr., Lington, A. W., McKee, R. H., and Klaunig, J. E. (2001). Reversibility and persistence of di-2-ethylhexyl phthalate (dehp)- and phenobarbitalinduced hepatocellular changes in rodents. Toxicol Sci 64, 192–99.
Ito, T., Horinouchi, A., Ozaki, H., Imawaka, M., Shirotsuka, Y., and Ando, T. (1998). Phenobarbital-induced inclusion bodies in dog hepatocytes. J Toxicol Pathol 11, 33–40.
Jezequel, A. M., Koch, M., and Orlandi, F. (1974). A morphometric study of the endoplasmic reticulum in human hepatocytes. Correlation between morphological and biochemical data in subjects under treatment with certain drugs. Gut 15, 737–47.
Jezequel, A. M., Orlandi, F., and Tenconi, L. T. (1971). Changes of the smooth endoplasmic reticulum induced by rifampicin in human and guinea pig hepatocytes. Gut 12, 984–87.
Jones, C. R., and Lubet, R. A. (1992). Induction of a pleiotropic response by phenobarbital and related compounds. Response in various inbred strains of rats, response in various species and the induction of aldehyde dehydrogenase in Copenhagen rats. Biochem Pharmacol 44, 1651–60.
Katsutani, N., Sekido, T., Aoki, T., and Sagami, F. (2000). Hepatic drug metabolizing enzymes induced by clofibrate in rash2 mice. Toxicol Lett 115, 223–29.
Kawabata, T. T., Guengerich, F. P., and Baron, J. (1981). An immunohistochemical study on the localization and distribution of epoxide hydrolase within livers of untreated rats. Mol Pharmacol 20, 709–14.
Kawabata, T. T., Guengerich, F. P., and Baron, J. (1983). Effects of phenobarbital, trans-stilbene oxide, and 3-methylcholanthrene on epoxide hydrolase within centrilobular, midzonal, and periportal regions of rat liver. J Biol Chem 258, 7767–73.
Klaunig, J. E., Babich, M. A., Baetcke, K. P., Cook, J. C., Corton, J. C., David, R. M., DeLuca, J. G., Lai, D. Y., McKee, R. H., Peters, J. M., Roberts, R. A., and Fenner-Crisp, P. A. (2003). Pparalpha agonist-induced rodent tumors: Modes of action and human relevance. Crit Rev Toxicol 33, 655–780.
Kliewer, S. A. (2003). The nuclear pregnane x receptor regulates xenobiotic detoxification. J Nutr 133, 2444S–2447S.
Kolaja, K. L., Stevenson, D. E., Walborg, E. F., Jr., and Klaunig, J. E. (1996). Reversibility of promoter induced hepatic focal lesion growth in mice. Carcinogenesis 17, 1403–9.
Krueger, L. A.,Campbell, B., Ndikum-Moffor, R., and Parkinson, A. (2005). A comparison of cytochrome P450 (CYP) enzyme induction in rat, mouse, dog, and monkey. Presented at the JSSX/ISSX Meeting, Maui, HI October 2005. www.jssx.org/jpn/nenkai/maui/MauiFinalProgram.pdf.
Kruger, C. L., Whittaker, M. H., Frankos, V. H., and Trimmer, G. W. (1999). 90-day oral toxicity study of d-tagatose in rats. Regul Toxicol Pharmacol 29, S1–10.
Kunz, H. W., Tennekes, H. A., Port, R. E., Schwartz, M., Lorke, D., and Schaude, G. (1983). Quantitative aspects of chemical carcinogenesis and tumor promotion in liver. Environ Health Perspect 50, 113–22.
Lake, B. G. (1995). Peroxisome proliferation: Current mechanisms relating to nongenotoxic carcinogenesis. Toxicol Lett 82–83, 673–81.
Liang, Q., He, J. S., and Fulco, A. J. (1995). The role of Barbie box sequences as cis-acting elements involved in the barbiturate-mediated induction of cytochromes P450BM-1 and P450BM-3 in Bacillus megaterium. J Biol Chem 270, 4438–50.
Lin, E. L., Klaunig, J. E., Mattox, J. K., Weghorst, C. M., McFarland, B. H., and Pereira, M. A. (1989). Comparison of the effects of acute and subacute treatment of phenobarbital in different strains of mice. Cancer Lett 48, 43–51.
Lindros, K. O. (1997). Zonation of cytochrome p450 expression, drug metabolism and toxicity in liver. Gen Pharmacol 28, 191–96.
Makino, T., Ishikawa, K., Igarashi, I., Yamoto, T., Manabe, S., and Nakayama, H. (2008). Relationship between gst yp induction and hepatocyte proliferation in rats treated with phase ii drug metabolizing enzyme inducers. Toxicol Pathol 36, 420–27.
Makino, T., Sehata, S., Igarashi, I., Watanabe, T., Ohashi, Y., Manabe, S., and Yamoto, T. (1998). Induction of glutathione s-transferases and hepatocellular proliferating activities in the rat liver treated with tert-butylated hydroxyanisole, 1,2-bis(2-pyridyl)ethylene, and phenobarbital. J Toxicol Pathol 11, 183–89.
Malarkey, D. E., Devereux, T. R., Dinse, G. E., Mann, P. C., and Maronpot, R. R. (1995). Hepatocarcinogenicity of chlordane in B6C3F1 and B6D2F1 male mice: Evidence for regression in B6C3F1 mice and carcinogenesis independent of ras proto-oncogene activation. Carcinogenesis 16, 2617–25.
Martignoni, M., Groothuis, G. M., and de Kanter, R. (2006). Species differences between mouse, rat, dog, monkey and human cyp-mediated drug metabolism, inhibition and induction.Expert Opin Drug Metab Toxicol 2, 875–94.
Massey, E. D., and Butler, W. H. (1979). Zonal changes in the rat liver after chronic administration of phenobarbitone in ultrastructural, morphometric and biochemical correlation. Chem Biol Interact 24, 329–44.
Matsubara, T., Touchi, A., and Ogawa, A. (1982). Heterogeneous distribution of the cytochrome p-450 monooxygenase system in rat liver lobes. Jpn J Pharmacol 32, 999–1011.
McKim, J. M., Jr., Kolesar, G. B., Jean, P. A., Meeker, L. S., Wilga, P. C., Schoonhoven, R., Swenberg, J. A., Goodman, J. I., Gallavan, R. H., and Meeks, R. G. (2001). Repeated inhalation exposure to octamethylcyclotetrasiloxane produces hepatomegaly, transient hepatic hyperplasia, and sustained hypertrophy in female Fischer 344 rats in a manner similar to phenobarbital. Toxicol Appl Pharmacol 172, 83–92.
Moody, D. E., Taylor, L. A., Smuckler, E. A., Levin, W., and Thomas, P. E. (1983). Immunohistochemical localization of cytochrome P-450a in liver sections from untreated rats and rats treated with phenobarbital or 3-methylcholanthrene. Drug Metab Dispos 11, 339–43.
Morimura, K., Cheung, C., Ward, J. M., Reddy, J. K., and Gonzalez, F. J. (2006). Differential susceptibility of mice humanized for peroxisome proliferator-activated receptor alpha to wy-14,643-induced liver tumorigenesis. Carcinogenesis 27, 1074–80.
Mugford, C. A., and Kedderis, G. L. (1998). Sex-dependent metabolism of xenobiotics. Drug Metab Rev 30, 441–98.
NTP (1993). TR-443. Toxicology and Carcinogenesis Studies of Oxazepam (CAS No. 604-75-1) in Swiss-Webster and B6C3F1 Mice (Feed Studies). National Toxicology Program, Research Triangle Park, NC.
O’Brien, M. L., Spear, B. T., and Glauert, H. P. (2005). Role of oxidative stress in peroxisome proliferator-mediated carcinogenesis. Crit Rev Toxicol 35, 61–88.
Parker, G. A., and Gibson, W. B. (1995). Liver lesions in rats associated with wrapping of the torso. Toxicol Pathol 23, 507–12.
Peters, J. M., Cattley, R. C., and Gonzalez, F. J. (1997). Role of ppar alpha in the mechanism of action of the nongenotoxic carcinogen and peroxisome proliferator wy-14,643. Carcinogenesis 18, 2029–33.
Porter, T. D., and Coon, M. J. (1991). Cytochrome p-450. Multiplicity of isoforms, substrates, and catalytic and regulatory mechanisms. J Biol Chem 266, 13469–72.
Powell, C., Secretan, B., and Cottrell, S. (1994). Preneoplastic changes during non-genotoxic hepatocarcinogenesis. In Liver Carcinogenesis: The Molecular Pathways (G. Skouteris, ed.). Springer.
Remmer, H. (1964). Drug induced formation of smooth endoplasmic reticulum and of drug metabolising enzymes. Proceedings of the European Society for the Study of Drug Toxicity 10, 57.
Reznik-Schuller, H. M., and Lijinsky, W. (1982). Ultrastructural changes in the liver of animals treated with methapyrilene and some analogs. Ecotoxicol Environ Saf 6, 328–35.
Richert, L., Tuschl, G., Viollon-Abadie, C., Blanchard, N., Bonet, A., Heyd, B., Halkic, N., Wimmer, E., Dolgos, H., and Mueller, S. O. (2008). Species differences in the response of liver drug-metabolizing enzymes to (s)-4-otolylsulfanyl-2-(4-trifluormethyl-phenoxy)-butyric acid (emd 392949) in vivo and in vitro. Drug Metab Dispos 36, 702–14.
Schlede, E., and Borowski, R. (1974). Decreased effect of phenobarbital treatment on microsomal drug metabolizing enzyme activity during gestation. Naunyn Schmiedebergs Arch Pharmacol 281, 341–55.
Schuetz, E. G., Brimer, C., and Schuetz, J. D. (1998). Environmental xenobiotics and the antihormones cyproterone acetate and spironolactone use the nuclear hormone pregnenolone x receptor to activate the CYP3A23 hormone response element. Mol Pharmacol 54, 1113–17.
Schulte-Hermann, R. (1974). Induction of liver growth by xenobiotic compounds and other stimuli. CRC Crit Rev Toxicol 3, 97–158.
Schulte-Hermann, R. (1979). Adaptive liver growth induced by xenobiotic compounds: Its nature and mechanism. Arch Toxicol Suppl, 113–24.
Schulte-Hermann, R., Hoffman, V., Parzefall, W., Kallenbach, M., Gerhardt, A., and Schuppler, J. (1980). Adaptive responses of rat liver to the gestagen and anti-androgen cyproterone acetate and other inducers. Ii. Induction of growth. Chem Biol Interact 31, 287–300.
Schulte-Hermann, R., Hoffman, V., and Landgraf, H. (1980). Adaptive responses of rat liver to the gestagen and anti-androgen cyproterone acetate and other inducers. Iii. Cytological changes. Chem Biol Interact 31, 301–11.
Schulte-Hermann, R., and Parzefall, W. (1980). Adaptive responses of rat liver to the gestagen and anti-androgen cyproterone acetate and other inducers. I. Induction of drug-metabolizing enzymes. Chem Biol Interact 31, 279–86.
Selim, N., Branum, G. D., Liu, X., Whalen, R., and Boyer, T. D. (2000). Differential lobular induction in rat liver of glutathione s-transferase a1/a2 by phenobarbital. Am J Physiol Gastrointest Liver Physiol 278, G542–50.
Shimada, T., Mimura, M., Inoue, K., Nakamura, S., Oda, H., Ohmori, S., and Yamazaki, H. (1997). Cytochrome p450-dependent drug oxidation activities in liver microsomes of various animal species including rats, guinea pigs, dogs, monkeys, and humans. Arch Toxicol 71, 401–8.
Shimada, T., Sugie, A., Shindo, M., Nakajima, T., Azuma, E., Hashimoto, M., and Inoue, K. (2003). Tissue-specific induction of cytochromes p450 1a1 and 1b1 by polycyclic aromatic hydrocarbons and polychlorinated biphenyls in engineered c57bl/6j mice of arylhydrocarbon receptor gene. Toxicol Appl Pharmacol 187, 1–10.
Slauson, D. O. and Cooper, B. J. (2001). Mechanism of Disease – A Textbook of Comparative General Pathology. Mosby, New York, NY; p. 122.
Stevenson, D. E., Kehrer, J. P., Kolaja, K. L., Walborg, E. F., Jr., and Klaunig, J. E. (1995). Effect of dietary antioxidants on dieldrin-induced hepatotoxicity in mice. Toxicol Lett 75, 177–83.
Stott, W. T. (1988). Chemically induced proliferation of peroxisomes: Implications for risk assessment. Regul Toxicol Pharmacol 8, 125–59.
Styles, J. A. (1993a). Measurement of ploidy and cell proliferation in the rodent liver. Environ Health Perspect 101 Suppl 5, 67–71.
Styles, J. A. (1993b). Detection and quantification of ploidy, nuclearity, and DNA synthesis in rat hepatocytes after administration of a peroxisome proliferator. Environ Health Perspect 101 Suppl 5, 225–27.
Styles, J. A., Kelly, M., and Elcombe, C. R. (1987). A cytological comparison between regeneration, hyperplasia and early neoplasia in the rat liver. Carcinogenesis 8, 391–99.
Sueyoshi, T., and Negishi, M. (2001). Phenobarbital response elements of cytochrome p450 genes and nuclear receptors. Annu Rev Pharmacol Toxicol 41, 123–43.
Tani, Y., Yamamoto, H., Kamai, Y., Maeda, N., Hosokawa, T., and Doi, K. (2001). Hepatic cyp1a inductionin 3-methylcholanthrene-treated transgenic rats with insufficient blood growth hormone. J Toxicol Pathol 14, 151–55.
Tsutsumi, M., Lasker, J. M., Shimizu, M., Rosman, A. S., and Lieber, C. S. (1989). The intralobular distribution of ethanol-inducible p450iie1 in rat and human liver. Hepatology 10, 437–46.
Ward, J. M., Konishi, N., and Ostergaard, K. (1989). Hepatic lesions in danish epileptics after long-term exposure to anticonvulsant drugs including phenobarbitone. J Natl Cancer Inst 81, 1753–54.
Ward, J. M. (1980). Unique toxic lesions induced by chemical carcinogens in rodents: Indications of a short–term bioassay for carcinogenesis of environmental chemicals. Med Hypothesis 6, 421–25.
Wastl, U. M., Rossmanith, W., Lang, M. A., Camus-Randon, A. M., Grasl-Kraupp, B., Bursch, W., and Schulte-Hermann, R. (1998). Expression of cytochrome p450 2a5 in preneoplastic and neoplastic mouse liver lesions. Mol Carcinog 22, 229–34.
Watanabe, J., Asaka, Y., and Kanamura, S. (1993). Postnatal development and sublobular distribution of cytochrome p-450 in rat liver: A microphotometric study. J Histochem Cytochem 41, 397–400.
Welsh, F. A. (1972). Changes in distribution of enzymes within the liver lobule during adaptive increases. J Histochem Cytochem 20, 107–11.
Whitlock, J. P., Jr. (1993). Mechanistic aspects of dioxin action. Chem Res Toxicol 6, 754–63.
Whysner, J., Ross, P. M., and Williams, G. M. (1996). Phenobarbital mechanistic data and risk assessment: Enzyme induction, enhanced cell proliferation, and tumor promotion. Pharmacol Ther 71, 153–91.
Williams, G. M., and Iatropoulos, M. J. (2002). Alteration of liver cell function and proliferation: Differentiation between adaptation and toxicity. Toxicol Pathol 30, 41–53.
Wilson, A. C., and Hiley, C. R. (1983). Effects of some hepatomegalic agents on liver DNA content: Relationship to changes in liver blood flow. J Pharm Pharmacol 35, 191–94.
Yamamoto, Y., Moore, R., Goldsworthy, T. L., Negishi, M., and Maronpot, R. R. (2004). The orphan nuclear receptor constitutive active/androstane receptor is essential for liver tumor promotion by phenobarbital in mice. Cancer Res 64, 7197–200.
Yu, S., Rao, S., and Reddy, J. K. (2003). Peroxisome proliferator-activated receptors, fatty acid oxidation, steatohepatitis and hepatocarcinogenesis. Curr Mol Med 3, 561–72.