
Figure 1. (NTP No. A83016). Normal, pars distalis. Treated female B6C3F1 mouse in a prechronic study. There is a relatively uniform distribution of acidophils, identified by strong cytoplasmic eosinophilia, admixed with other cell types. Definitively identifying basophils and chromophobes is difficult based on hematoxylin & eosin-stained sections. In this example, concentration of acidophils is more apparent in central and mid-portions versus peripheral subcapsular aspects of the pars distalis. In older mice, variable regional distribution of different pars distalis cell types is common. Definitive identification of cell types can be confirmed by immunohistochemistry.
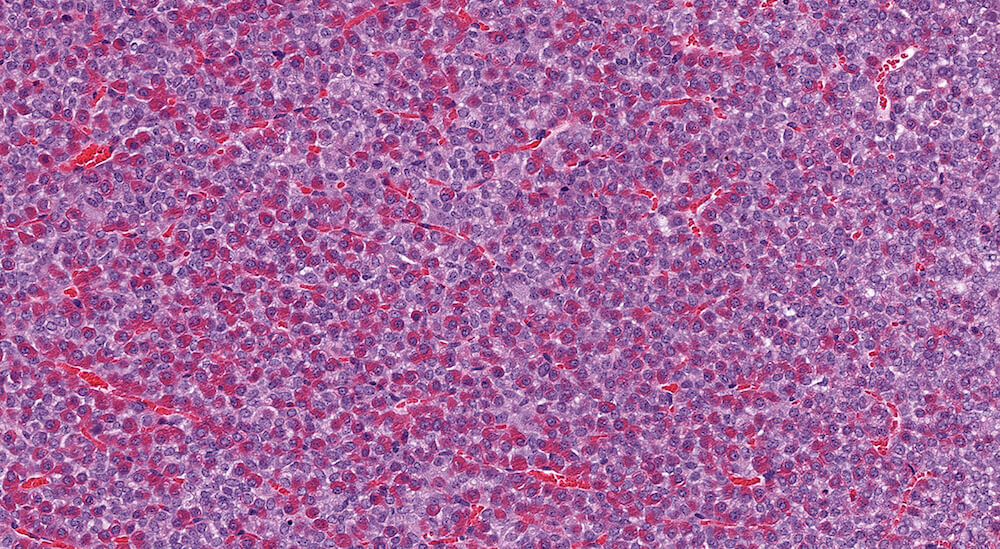
Figure 2. (NTP No. A83018). Higher magnification of Figure 1. In this higher magnification of Figure 1, acidophils are clearly evident and there is a slightly higher concentration of acidophils in the left half of the image versus the more peripherally located right side of the pars distalis.

Figure 3. (NTP No. A83044). Hyperplasia, pars distalis & Cyst, pars distalis. Control female B6C3F1 mouse from a chronic study. A large poorly delimited area of slightly paler staining cells has distorted one side of the pars distalis. The cells comprising this area of hyperplasia represent a mixture of cells typically present in the pars distalis. A single cyst present at the top edge of the focal hyperplasia contains finely flocculent eosinophilic proteinaceous material.
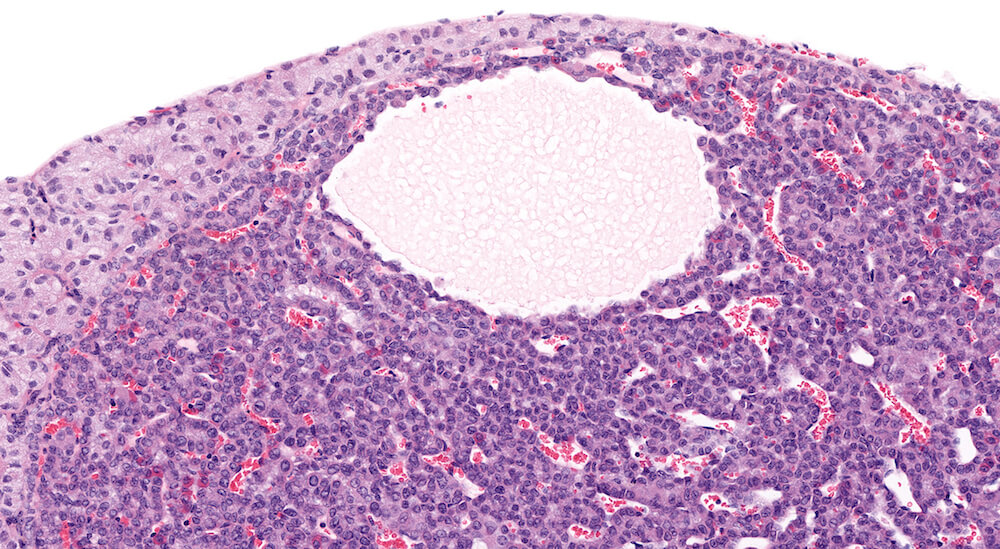
Figure 4. (NTP No. A83046). Higher magnification of Figure 3 showing details of the cyst. The cyst is lines by normal pars distalis cells some of which are slightly flattened. Finely flocculent pale staining eosinophilic material is present in the cyst.
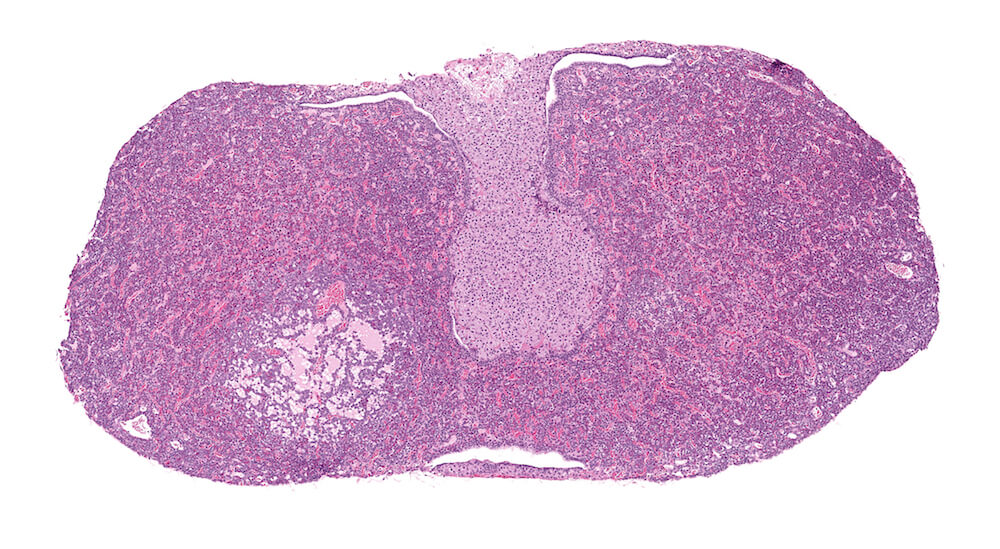
Figure 5. (NTP No. A83042). Cystic degeneration, pars distalis. Vehicle female B6C3F1 from a chronic study. A focal area of irregular cystic spaces filled with pale, finely granular eosinophilic fluid with vacuoles is present in the pars distalis without causing compression of the pars distalis parenchyma.

Figure 6. (NTP No. A83043). Higher magnification of Figure 5. The small vacuoles and finely granular eosinophilic material represent cytoplasmic degeneration. Occasional pyknotic nuclei are present along the edges of this cystic degeneration.
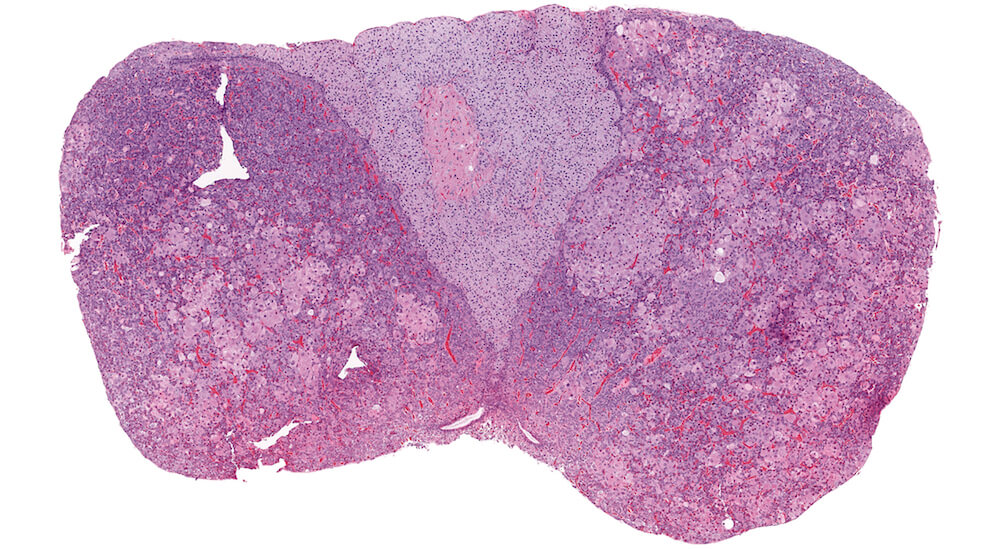
Figure 7. (NTP No. A83047). Chromophobe cell hypertrophy, multifocal, pars distalis. Treated female Tg.AC (FVB/N) hemizygous mouse from a chronic study. Multiple irregular single and confluent nests of pale eosinophilic staining cells are present in both halves of the pars distalis causing distortion and enlargement, especially on one side of the pituitary gland.
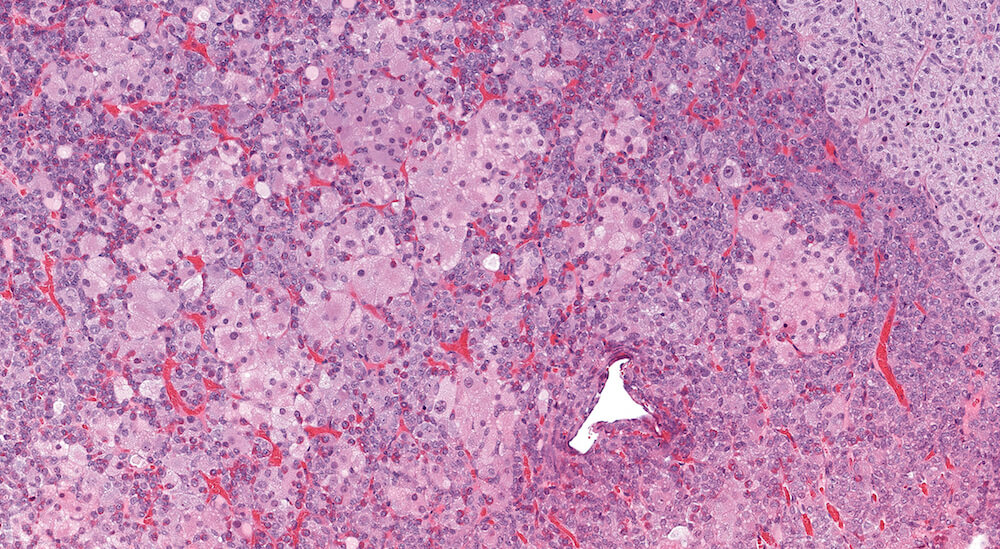
Figure 8. (NTP No. A83048). Higher magnification of Figure 7. The hypertrophic cells have round nuclei with single nucleoli and abundant pale eosinophilic foamy cytoplasm. While irregularly shaped clusters of markedly hypertrophic cells are readily apparent, less conspicuous hypertrophic cells are distributed throughout the pars distalis.
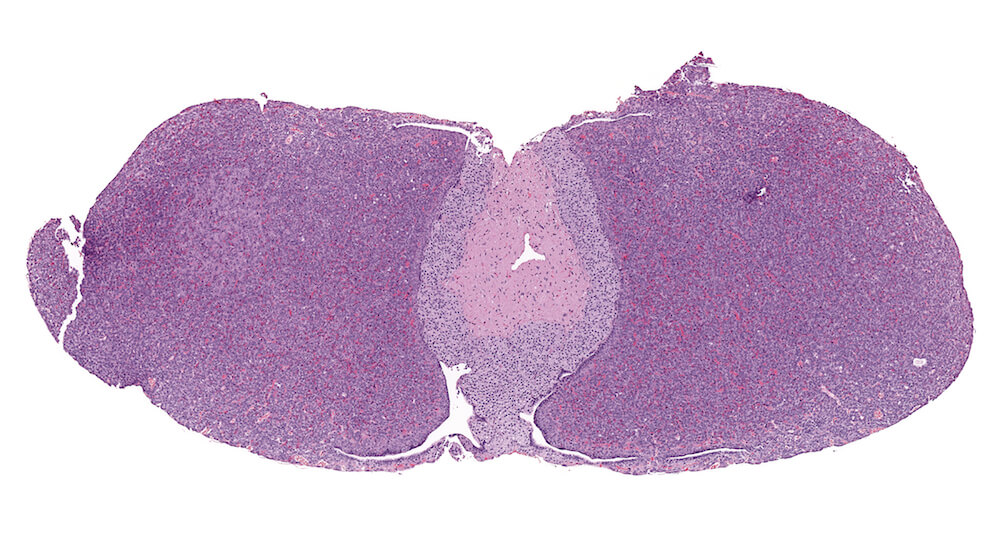
Figure 9. (NTP No. A83049). Hypertrophy, focal, pars distalis. Treated female p53+/- (C57BL/N) mouse from a chronic study. A localized focal area of pale staining cells is present on one side of the pars distalis without any evidence of compression or distortion of the pituitary gland.

Figure 10. (NTP No. A83051). Higher magnification of Figure 9. The hypertrophic cells are chromophobic with round to oval nuclei and pale amphophilic finely foamy cytoplasm. Occasional acidophils are present within the focus of hypertrophy.
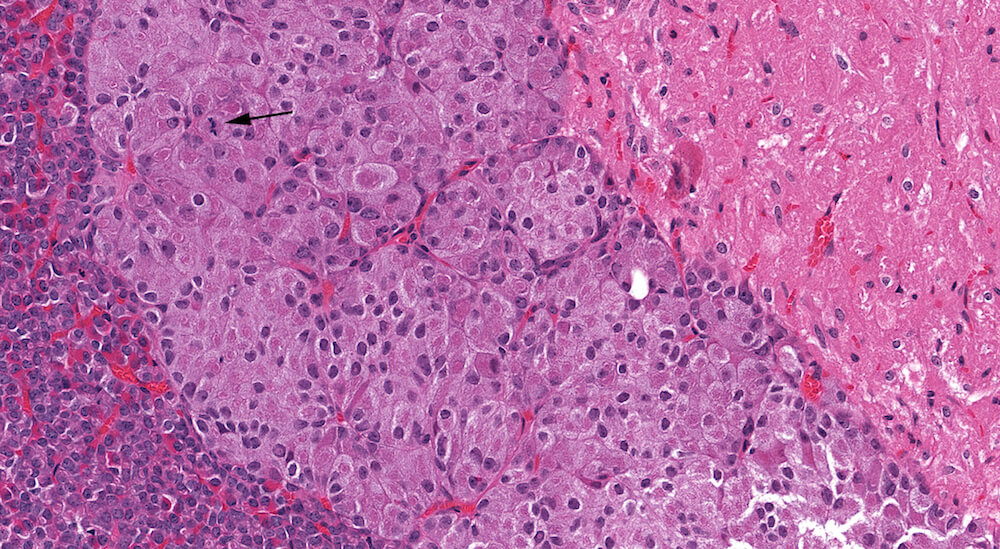
Figure 11. (NTP No. A83052). Hypertrophy, pars intermedia. Treated female Tg.AC (FVB/N) hemizygous mouse from a chronic study. Irregular individual and confluent nests of enlarged cells have occupied and expanded the area of the pars intermedia. Many of the hypertrophic cells are undergoing degeneration with loss of nuclear staining (karyolysis). One mitotic figure is present (arrow).
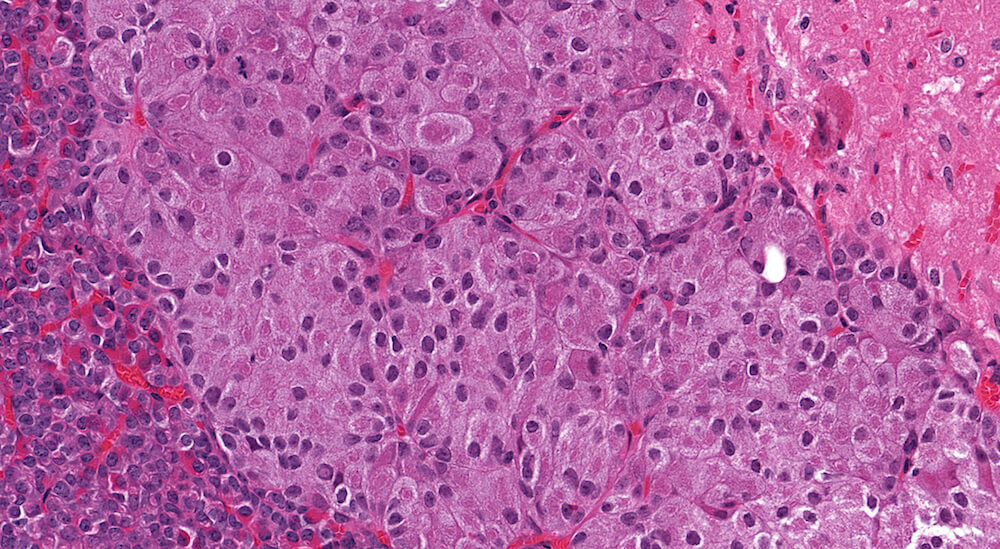
Figure 12. (NTP No. A83053). Higher magnification of Figure 11.
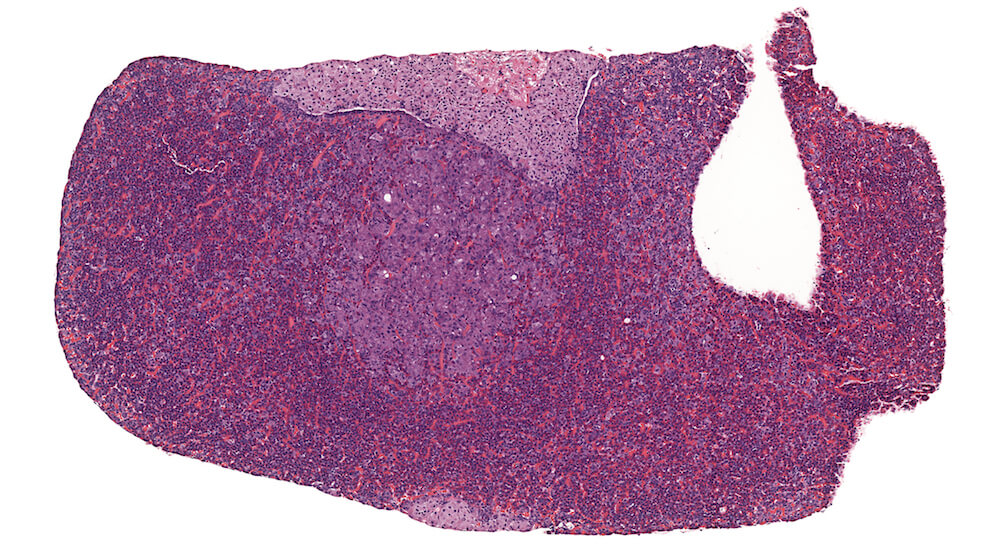
Figure 13. (NTP No. A83033). Hyperplasia, pars distalis. Treated male B6C3F1 mouse from a chronic study. A pale staining collection of chromophobic cells in the pars distalis is present without causing compression of adjacent structures. Although this focal lesions consists of chromophobic cells that are larger than chromophobes elsewhere in the section, the increased nuclear density is indicative of hyperplasia. In contrast, a very small collect of hypertrophic chomophobic cells is located at the bottom center edge of this section.
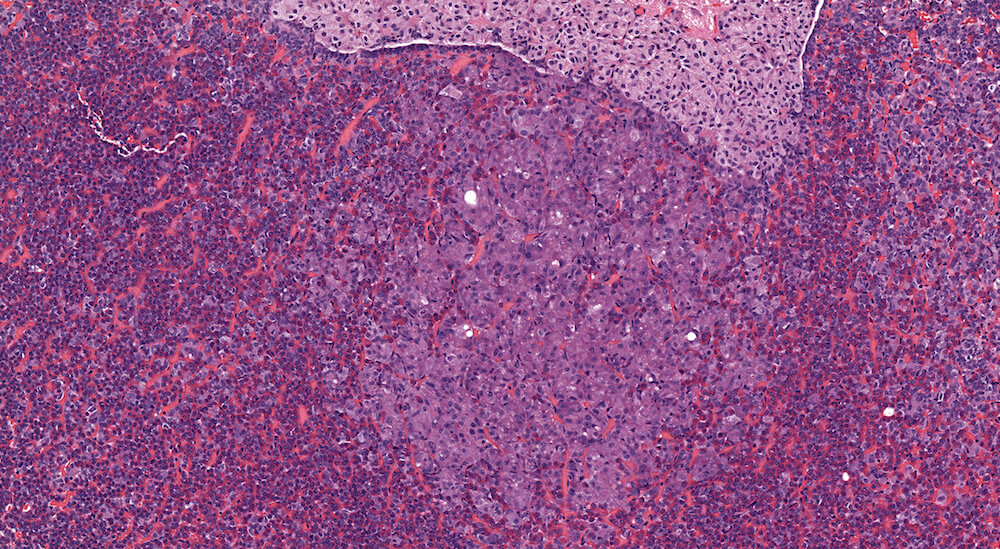
Figure 14. (NTP No. A83034). Higher magnification of Figure 13. In this higher magnification of Figure 13, small clusters and nest of chromophobic cells with round, oval and occasionally elongated nuclei are separated by blood-filled capillaries. There is no compression of adjacent pars distalis parenchyma. Although classified as a focal hyperplasia of the pars distalis, many of the cells in this focus are also hypertrophic.
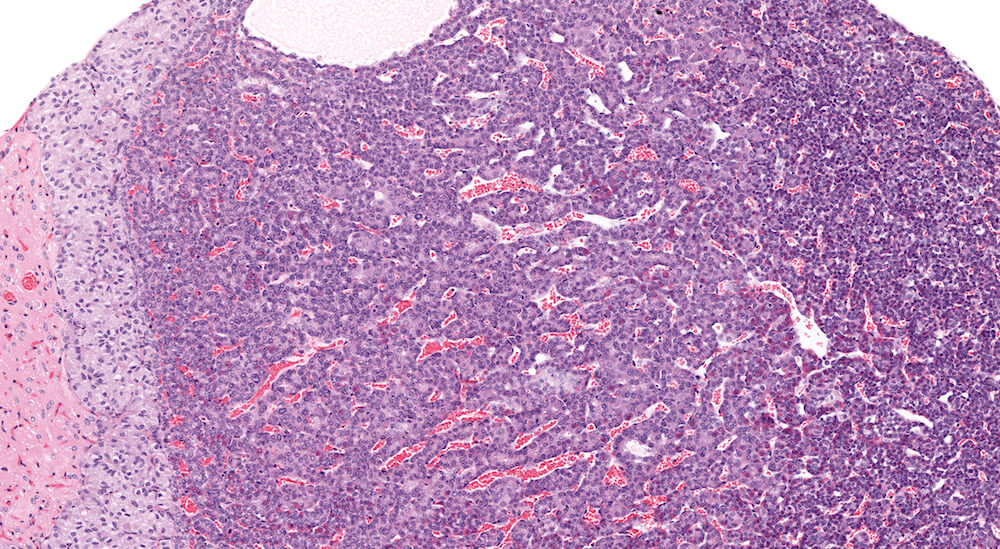
Figure 15. (NTP No. A83045). Higher magnification of Figure 3. The area of pars distalis hyperplasia consists largely of chromophobic cells in contrast to the more normal mixed cellular population on the right edge of the hyperplasia where abundant acidophils and smaller more basophilic staining cells are present. The hyperplasia is not sharply demarcated from adjacent pars distalis parenchyma.
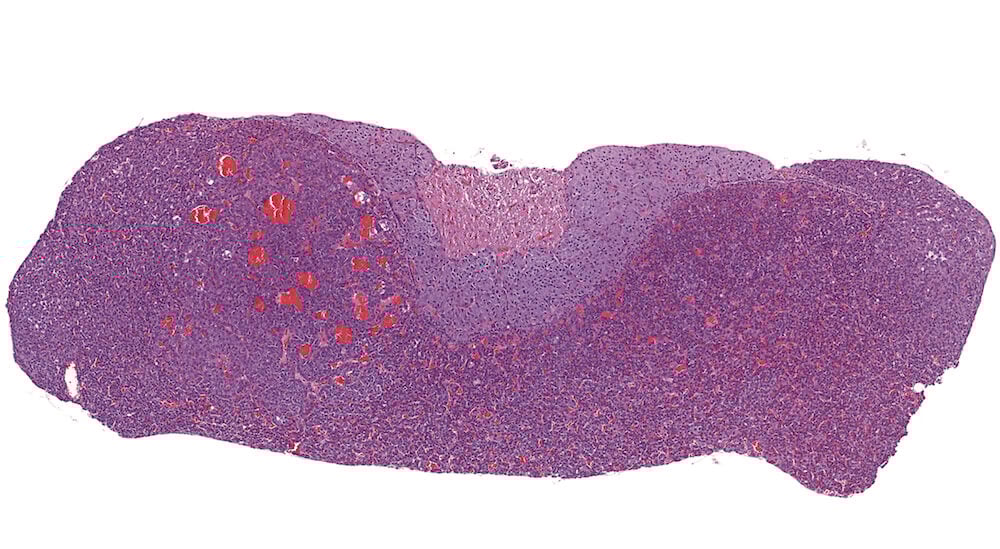
Figure 16. (NTP No. A83024). Adenoma, pars distalis. Treated female B6C3F1 mouse from a chronic study. A well vascularized expansile mass in the pars distalis has slightly distorted the shape of the pituitary and is compressing the pars intermedia. The blood-filled spaces represent dilated capillaries. Since there is no sharp compression or demarcation affecting the pars distalis, this represents a borderline lesion with diagnoses between pars distalis focal hyperplasia and pars distalis adenoma. The final diagnosis of adenoma is based on compression of the pars intermedia.
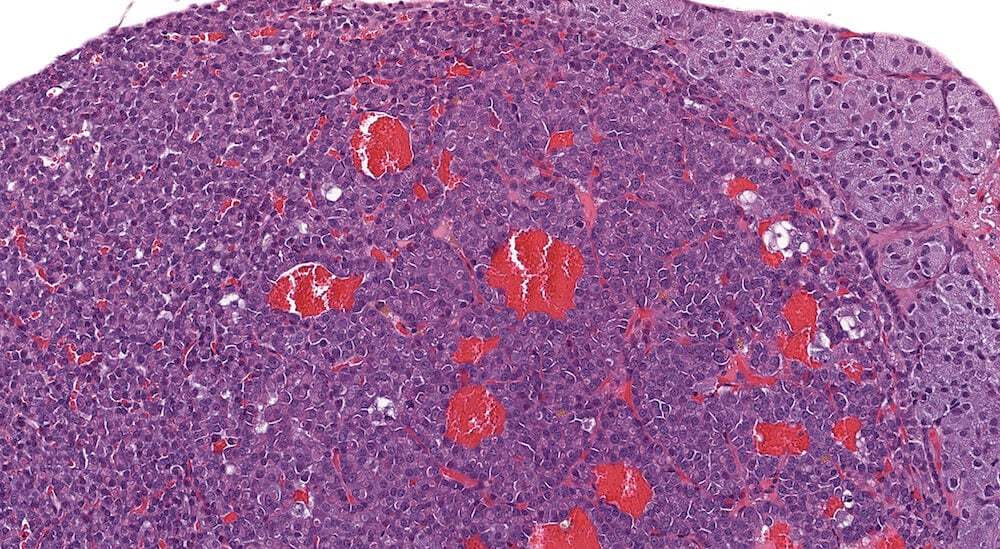
Figure 17. (NTP No. A83026). Higher magnification of Figure 16. In this higher magnification of Figure 16, clear distinction of different pars distalis cell types is not apparent. Dilated blood-filled capillaries are evident and cytoplasmic vacuolar degeneration is present in scattered adenoma cells.
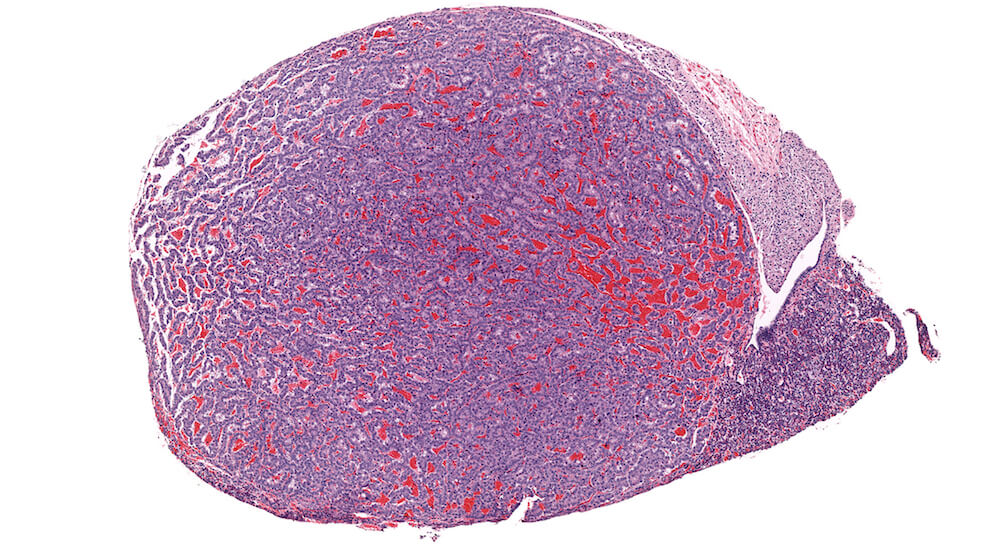
Figure 18. (NTP No. A83054). Adenoma, pars distalis. Treated male B6C3F1 mouse from a chronic study. A markedly enlarge half of the pars distalis is comprised of a well vascularized proliferative mass of normal appearing pars distalis cells with compression of remaining pituitary structures.

Figure 19. (NTP No. A83055). Higher magnification of Figure 18. Closely spaced cells with uniformly round nuclei and scant pale eosinophilic cytoplasm are arranged in small nests, rows, and trabeculi separated by capillaries.
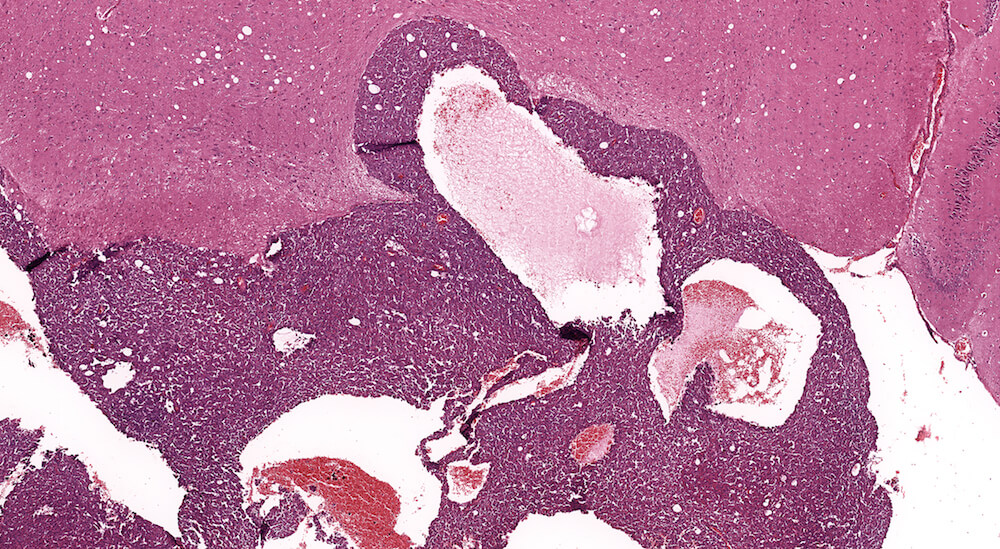
Figure 20. (NTP No. A83030). Carcinoma, pars distalis. Control female B6C3F1 mouse from a chronic study. A highly cellular mass of darkly staining cells is extending into the overlying brain tissue. The neoplasm is comprised of a large sheet of cells interrupted by large vascular lakes occupying multiple areas of this growth.
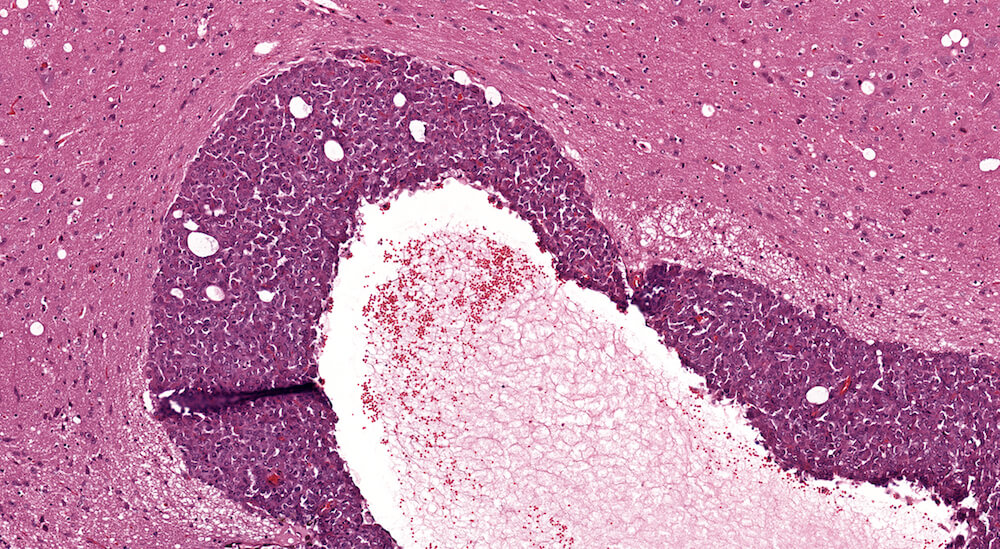
Figure 21. (NTP No. A83031). Higher magnification of Figure 20.
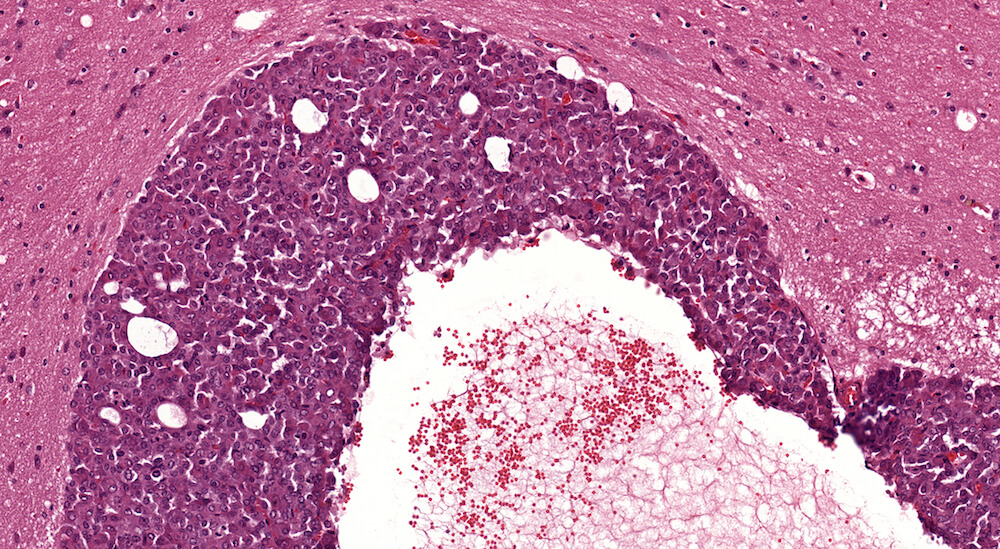
Figure 22. (NTP No. A83032). Higher magnification of Figure 20. The cells comprising this carcinoma have poorly defined cytoplasmic borders with some crowding of round to oval leptochromatic nuclei. Definitive cell types characteristic of pars distalis are not clearly identifiable.
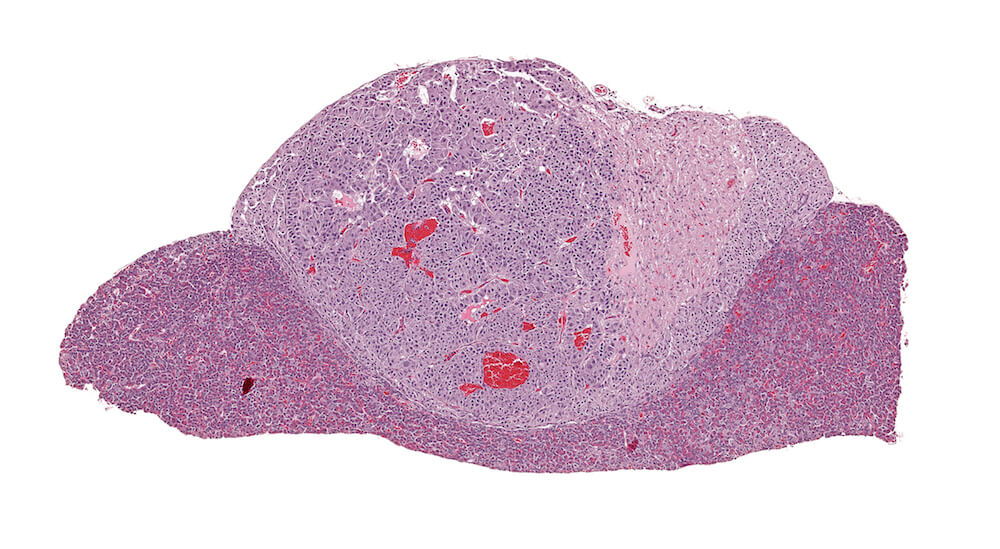
Figure 23. (NTP No. A83019). Adenoma, pars intermedia. Treated B6C3F1 male in a chronic study. A markedly expanded cell proliferative response of one side of the pars intermedia has distorted the shape of the pituitary gland with compression of the pars distalis and pars intermedia. The adenoma is comprised of nests of cells that are larger than the pars intermedia cells on the other side of the pituitary. A diagnosis of adenoma is based on compression caused by this lesion.
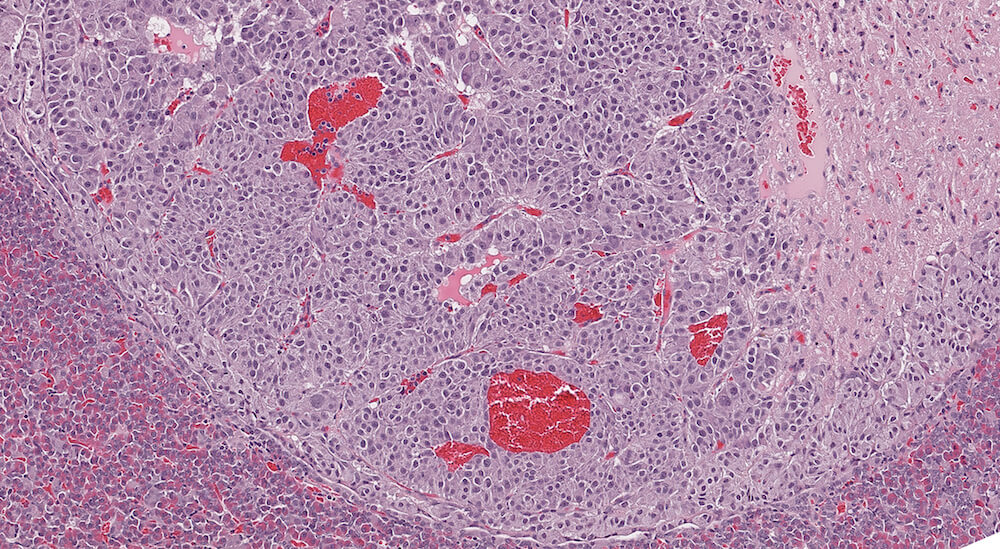
Figure 24. (NTP No. A83020). Higher magnification of Figure 23. The cellular nests comprising this adenoma are clearly separated by capillaries some of which are dilated and felled with blood. A few adenoma cells have cytoplasmic vacuolar degeneration and there is some evidence of nuclear polyploidy.

Figure 25. (NTP No. A83021). Adenoma, pars intermedia. Treated B6C3F1 male in a chronic study. A well circumscribed expansile proliferation of neoplastic cells is present in the pars intermedia causing prominent compression of the pars nervosa and the pars distalis. This adenoma is comprised of loosely arranged uniform cells arranged in irregular clusters. Cells in the adenoma have slightly greater cytoplasmic volume compared to normal pars intermedia cells. The diagnosis of adenoma is based on compression.
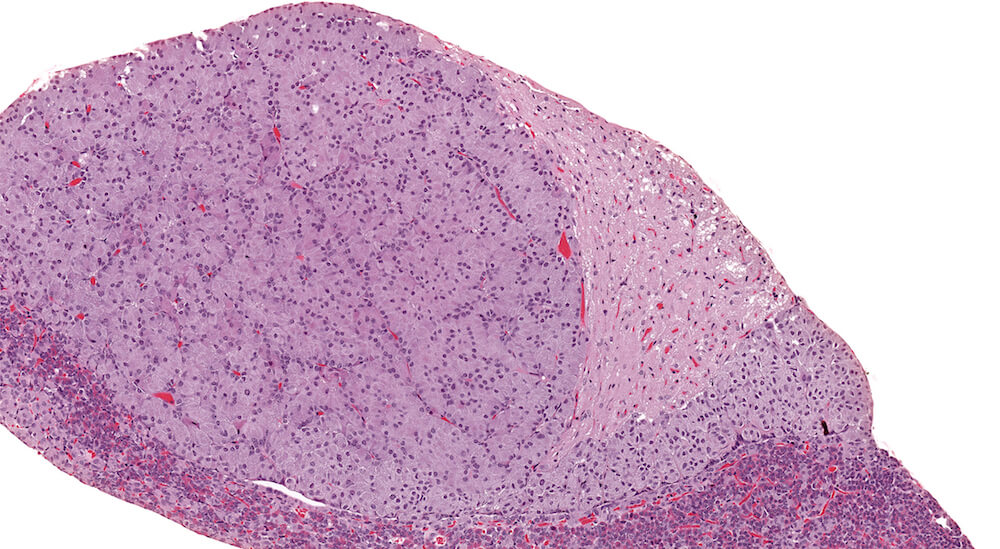
Figure 26. (NTP No. A83022). Higher magnification of Figure 25.
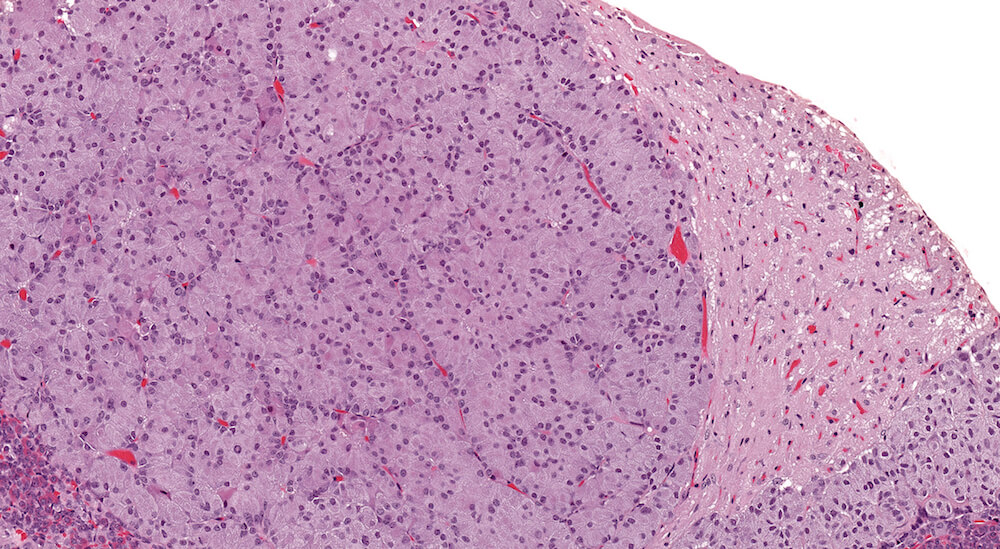
Figure 27. (NTP No. A83023). Higher magnification of Figure 25.
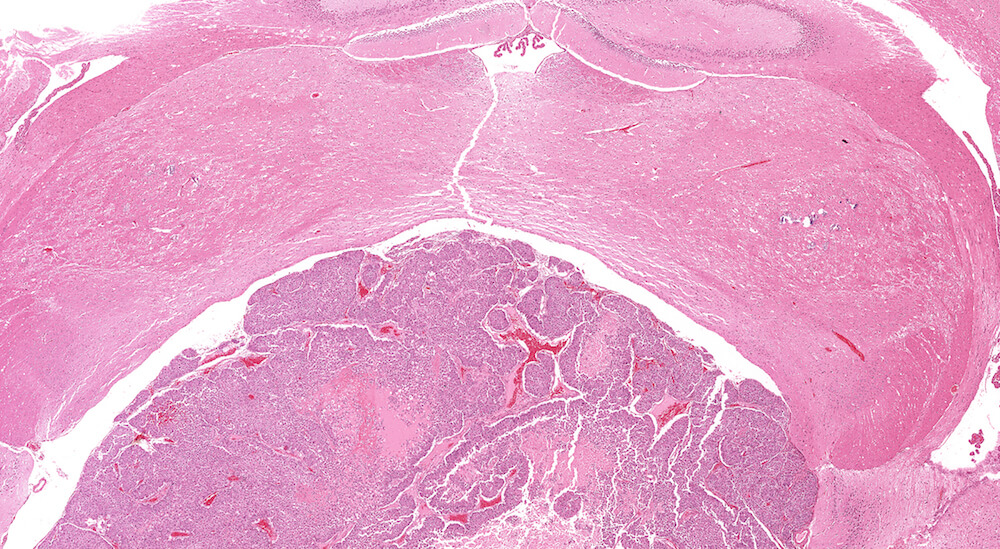
Figure 28. (NTP No. A83027). Carcinoma, pars intermedia. Vehicle male B6C3F1 mouse in a chronic study. The expansile proliferating pars intermedia growth has caused compression of the overlying brain. The neoplasm is comprised of sheets, columns, and some nests of proliferating cells together with dilated blood-filled spaces and pale staining areas of necrosis.
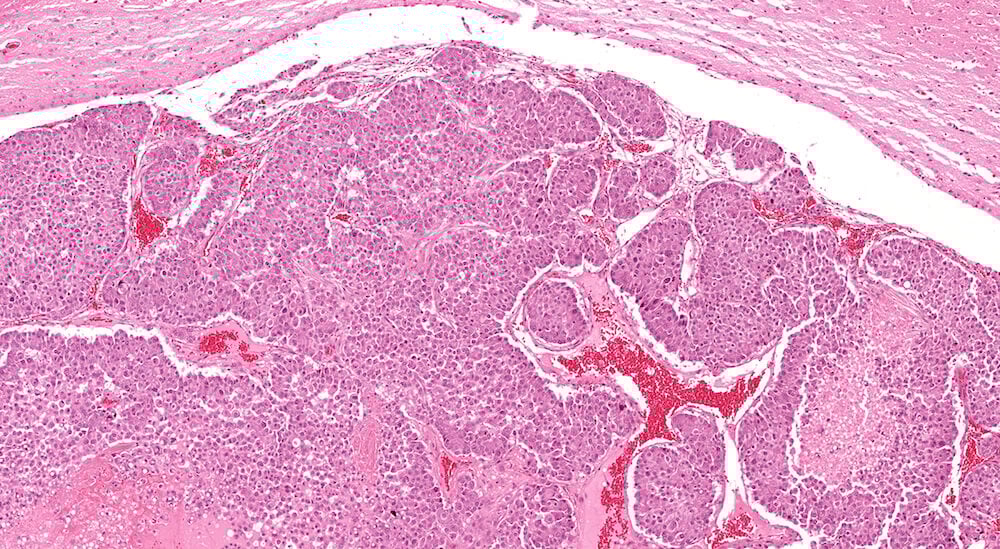
Figure 29. (NTP No. A83029). Higher magnification of Figure 28. This higher magnification shows sheets and nests of neoplastic cells separated by a delicate fibrous stroma. Neoplastic cells are rounded with pink cytoplasm and centrally localized nuclei that have one or two nucleoli. Areas of tumor necrosis are present near the right edge and in the lower left corner of the image.

Figure 30. (NTP No. A83038). Histiocytic sarcoma. Treated female B6C3F1 mouse from a chronic study. A band of histiocytic sarcoma cells is present along the left edge of the pars distalis. Some cells within the pars distalis with large open-faced nuclei and pale cytoplasm may represent malignant histiocytes but definitive identification versus degenerating chromophobic cells is difficult.
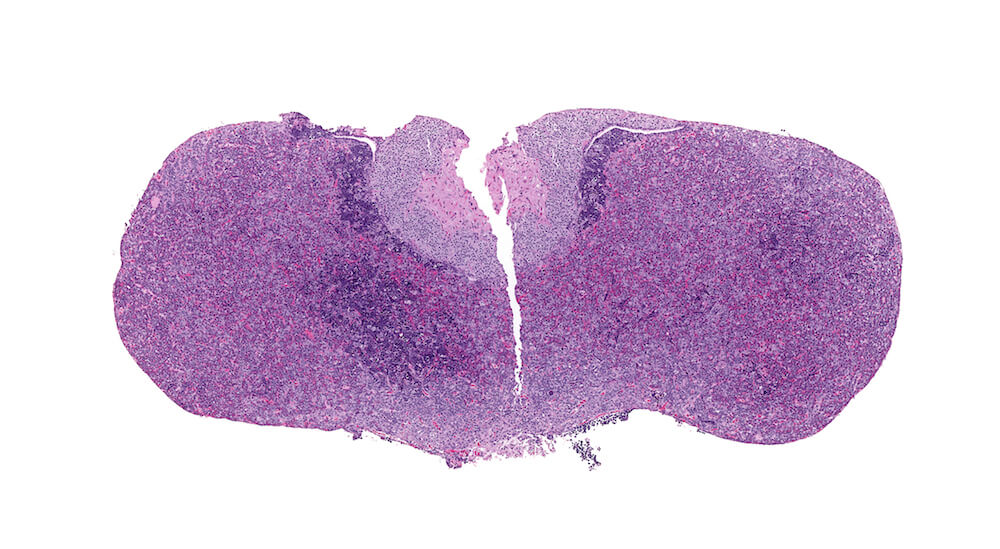
Figure 31. (NTP No. A83039). Erythroleukemia. Treated male Tg.AC (FVB/N) hemizygous mouse. Clusters of deeply basophilic cells are present in the body of the pars distalis and at the margins of the pars distalis and pars intermedia.
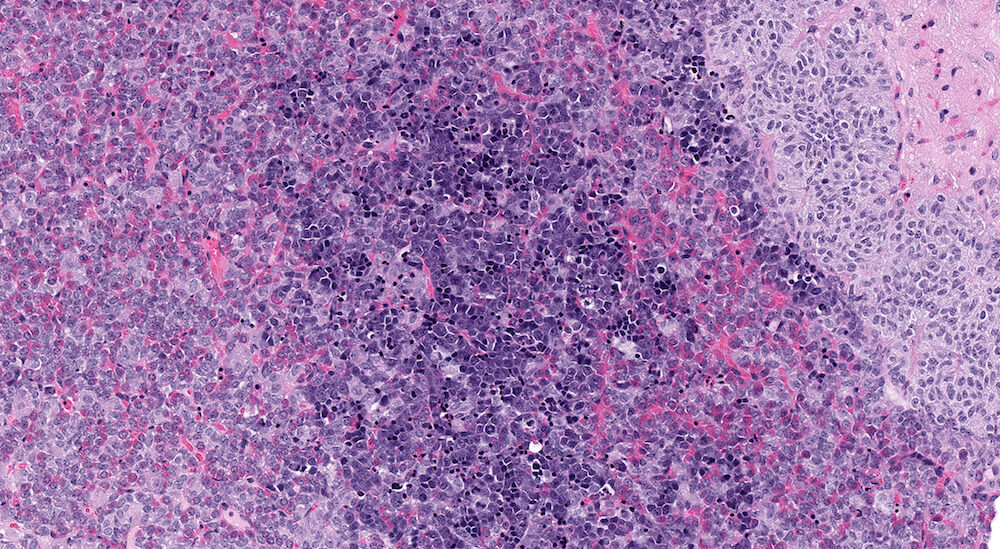
Figure 32 (NTP No. A83041). Higher magnification of Figure 31. The infiltrating leukemia cells consist of different stages of immature erythyroid cells with a predominance of proerythroblasts along with polychromatic erythroblasts arranged in small clusters. Elsewhere in this pituitary section polychromatic erythroblasts can be seen within capillaries.