Gardenia blue is widely used in Eastern Asia as a natural food colorant. To evaluate the genotoxic potential of gardenia blue, as well as genipin, the natural starting material from which it is produced, a GLP-compliant test battery was conducted according to OECD guidelines. No evidence of mutagenicity of gardenia blue was detected in a 5-strain bacterial reverse mutation assay, with or without metabolic activation; an equivocal response for genipin occurred in S. typhimurium TA97a without metabolic activation. In in vitro micronucleus and chromosome aberration assays, genipin tested positive under some test conditions; however, gardenia blue tested negative in both assays. In combined micronucleus/comet assays conducted in male and female B6C3F1 mice, exposure to genipin at doses reaching maximal toxicity (74 and 222 mg/kg bw/day for males and females, respectively) or gardenia blue tested up to the limit dose (2000 mg/kg bw/day) did not induce micronuclei in peripheral blood or DNA damage in several examined tissues. Modified (“reverse”) comet assays showed no evidence of DNA crosslinking potential of either genipin, known to form crosslinks with other macromolecules, or gardenia blue. Our results indicate that consumption of gardenia blue in food products does not pose a significant genotoxic concern for humans.
1. Introduction
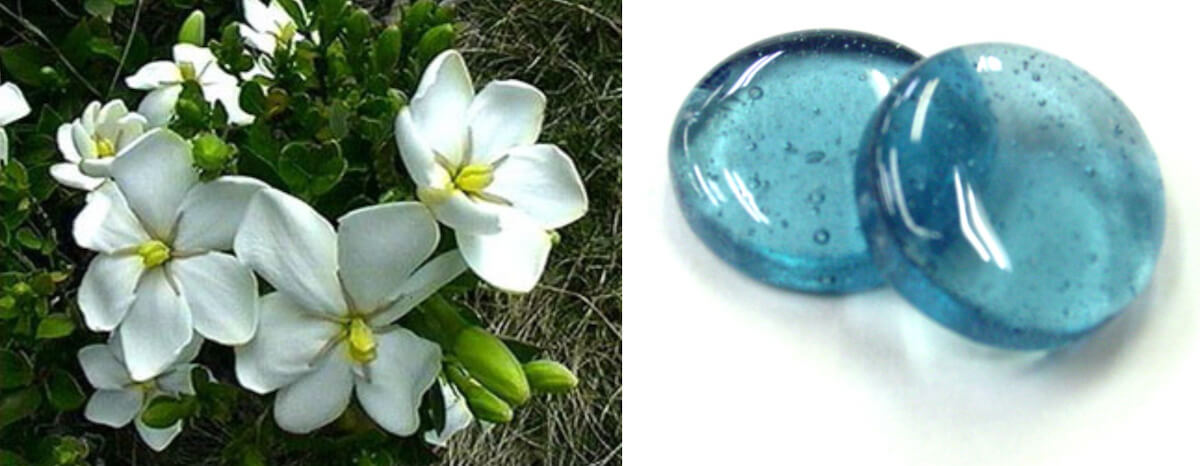
Gardenia blue is a natural colorant widely used in Asia in frozen desserts, confections and baked goods, jams, noodles, beverages, wine and liqueurs, processed seafood and agricultural products. It is produced commercially by adding β-glucosidase to a mixture of iridoid glycosides extracted from the fruits of Gardenia jasminoides Ellis (Gardenia augusta Merrill) to yield genipin, the aglycone of geniposide (Fig. 1). Although genipin itself has no color, reaction with primary amino acids and protein hydrolysates leads to formation of blue color, providing utility as a natural dye for textiles, cosmetics and food products.
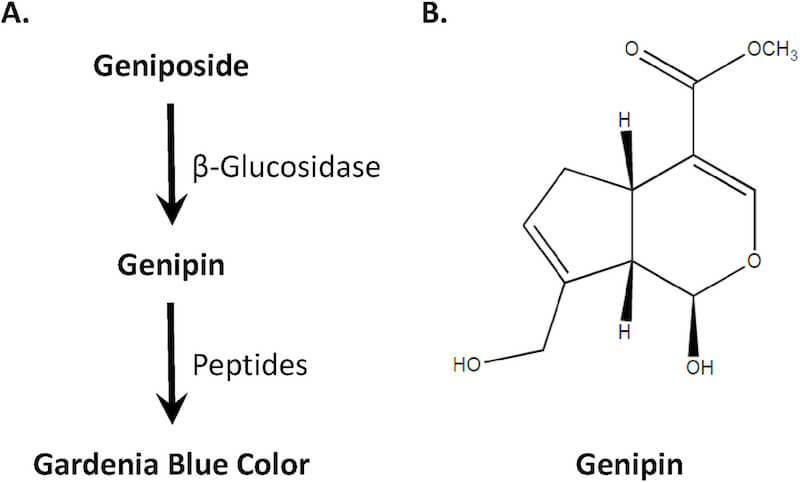
Fig. 1. Derivation of Gardenia Blue Color. (A) Hydrolysis of glycosides extracted from the fruits of Gardenia jasminoides Ellis using β-glucosidase yields genipin. Reaction of genipin with protein hydrolysates (e.g., peptides from soy protein) leads to formation of blue pigment. The resulting crosslinked material is characterized by a broad molecular weight range with a peak of ∼15,000; the commercial product may contain dextrin or lactose. (B) Molecular structure of genipin (MW = 226.23).
Gardenia fruit containing geniposide and genipin has long been used in traditional Chinese medicine, and has been reported to possess pharmacological properties such as the inhibition of liver apoptosis, neuroprotective and anti-depressive effects, and anti-inflammatory activity (Koo et al., 2006; Tanaka et al., 2009; Yamamoto et al., 2000; Yamazaki et al., 2001; Ye et al., 2018). Genipin generates crosslinks spontaneously with protein, collagen, gelatin and chitosan, although the crosslinking mechanism between genipin and molecules containing a primary amine is not yet understood (Sung et al., 1999; Yan et al., 2010; Yoo et al., 2011). Because of its natural crosslinking ability, genipin has been investigated as an alternative to glutaraldehyde as an inducer of biochemical crosslinking in tissue, including as a fixation agent for heterograft tissues (Yoo et al., 2011) and as a biodegradable coating on sutures for repair of ruptured connective tissue(Sundararaj et al., 2017). It is uncertain whether genipin forms crosslinks with DNA; limited in vitro testing suggests it has genotoxic potential (Ozaki et al., 2002; Tsai et al., 2000).
A number of genotoxicity studies of gardenia blue have been conducted previously in Japan (Hachiya and Takizawa, 1992; Hachiya et al., 1985; Ishidate et al., 1981; Yasui et al., 1982; Yoshizumi et al., 1980). However, the purity of the gardenia blue used in these studies was not well-defined, the study data are not readily available (not published in the peer-reviewed literature), and most notably, the studies do not satisfy current regulatory standards for marketing products containing gardenia blue in U.S. or European markets. To facilitate worldwide marketing of gardenia blue as a natural food colorant following authorization by the U.S. Food and Drug Administration (FDA), the European Union, and a positive safety opinion from JECFA, a FAO/WHO Joint Expert Committee on Food Additives, we evaluated both gardenia blue and genipin in a Good Laboratory Practices (GLP)-compliant test battery in accordance with contemporaneous EFSA, OECD, and FDA guidances on genotoxicity and toxicity testing (EFSA, 2011; FDA, 2000a, b, c; OECD, 1997a, b, c, 2010, 2014a, b, 2016a, b). Genipin was evaluated because it is a potential impurity in gardenia blue color and can be produced in vivo as a result of intestinal microbial interactions with gardenia blue used in food products. The results of the comprehensive assessment of genotoxicity are reported here, including bacterial reverse mutation assays, in vitro mammalian micronucleus and chromosome aberration assays, and combined micronucleus/comet assays conducted in male and female B6C3F1 mice.
We also investigated the potential of genipin to cause DNA crosslinks in vitro and in vivo. Two approaches were undertaken to evaluate the potential for genipin exposure to induce DNA damage or DNA crosslinking using human TK6 lymphoblastoid cells: 1) a standard alkaline comet assay in which the electrophoresis time was extended to maximize detection of any reduction in the amount of damaged DNA (measured as % tail DNA) following electrophoretic separation, indicative of DNA crosslinking, and 2) a reverse comet assay that relies on the capability of a crosslinking agent to reduce the % tail DNA detected following treatment with a known DNA damaging agent (Fikrova et al., 2013; Jost et al., 2015; McKenna et al., 2003; Pant et al., 2015). To investigate crosslinking resulting from exposure to genipin in vivo, a reverse comet assay was used to evaluate DNA crosslinking in the liver of mice administered genipin. To extend the genotoxicity assessment of gardenia blue, a reverse comet assay was conducted to evaluate DNA crosslinking in the liver of mice administered gardenia blue or cisplatin, a known crosslinking agent.
2. Material and methods
2.1. Chemical analysis
All standard genotoxicity assays were conducted in accordance with OECD guidelines and were GLP-compliant. Genipin (99.982% pure; CAS No. 6902-77-8; MW = 226.23) was obtained from Glico Nutrition Co., Ltd. (Osaka, Japan); gardenia blue was prepared according to the specifications outlined in the 8th edition of the Japanese Specifications and Standards for Food Additives and provided by San-Ei Gen F.F.I., Inc. (Osaka, Japan). The composition of the gardenia blue preparation was: gardenia blue (24.8%), dextrin (69.4%), water (4.6%), and other components (1.2%); residual genipin was less than 10 ppm. Samples removed from the top, middle, and bottom fractions of each chemical formulation were submitted for analytical testing (OpAns, LLC, Durham, NC and Alera Laboratories, LLC, Durham, NC) to verify concentrations; chemical formulations were determined to be stable over the course of the experiments. For the bacterial mutagenicity test of genipin, the top concentration tested was higher than the upper limit specified by the OECD test guideline to ensure that the guideline was met despite any variation from the nominal dose of 5000 μg/plate as determined by chemical analysis of the dose formulation; in subsequent tests, a concentration within 10% of the guideline recommended maximum was deemed acceptable.
2.2. Bacterial reverse mutation assay
Bacterial reverse mutation assays were performed in accordance with the OECD Test Guideline No. 471: Bacterial Reverse Mutation Test (OECD, 1997b), which is based on published methods (Ames et al., 1975; Gatehouse et al., 1994; Maron and Ames, 1983). The five strains (Salmonella typhimurium TA97a, TA98, TA100, TA1535 and E. coli WP2 uvrA pKM101) used in the assay were purchased from Moltox, Inc. (Boone, NC), maintained as frozen stocks, and checked for maintenance of genetic markers prior to the study. The mutagenicity assays were performed using the pre-incubation method with (+S9) and without (–S9) metabolic activation provided by phenobarbital/benzoflavone-induced rat liver S9 (Moltox, Boone, NC) with cofactors (Regensys™ NADPH Regeneration System Reagents, Moltox, Boone, NC). The composition of the S9 mix was: 10% S9, 8 mM MgCl2, 32.6 mM KCl, 4.7 mM glucose-6-phosphate, 4 mM NADP and 0.1 M phosphate buffer. Assay tubes were incubated at 37 °C for 20 min before plating onto minimal agar. Three plates per concentration were incubated at 37 °C for 48 h and then counted using the Sorcerer/Ames Study Manager system (Perceptive Instruments, Suffolk, U.K.). Dimethyl sulfoxide (DMSO) and sterile water were used as the vehicles for genipin and gardenia blue, respectively. Positive control chemicals were included in the assays.
2.3. In vitro micronucleus assay
In vitro micronucleus assays were conducted using human TP53 competent human lymphoblast TK6 cells (ATCC, Manassas, VA) according to OECD 487 (OECD, 2014a) as described previously (Hobbs et al., 2015). Triplicate cultures of exponentially growing cells seeded at 2–4 x 10⁵ cells/mL in 12-well plates were exposed to genipin, gardenia blue or controls for four hours ± S9 and 24 h –S9. Based on dose setting toxicity and initial tests, the maximum concentration of genipin (formulated in DMSO) selected for testing was 75 μg/mL for 4 h with metabolic activation and 10 μg/mL for 24 h in the absence of metabolic activation; gardenia blue (dissolved in sterile water) was evaluated at a maximum concentration of 5000 μg/mL for all test conditions. At the end of the culture period, cells were analyzed for cytotoxicity and micronucleus induction by flow cytometry (Avlasevich et al., 2006; Bryce et al., 2007) using the In Vitro MicroFlow™ kit (Litron Laboratories, Rochester, NY) according to manufacturer’s instructions. Unless limited by cytotoxicity, 20,000 cells from each sample were analyzed for the frequency of micronuclei (MN) using a FACSCalibur™ dual-laser bench top system (Becton Dickinson Biosciences, San Jose, CA). Cytotoxicity induced by genipin was measured as relative survival of cells in treated cultures compared to cells from vehicle control cultures using ratios of counted nuclei to counted beads (inert latex microspheres added to each sample); higher nuclei to bead ratios correspond to increased cell survival. For stricter adherence to OECD 487 (OECD, 2014a) during gardenia blue testing, viable cell counts were determined and used to calculate relative increase in cell count (RICC) in treated cultures.
2.4. Chromosomal aberration assays
Chromosomal aberration assays using Chinese hamster ovary CHO-WBL cells were conducted as described previously (Hobbs et al., 2012) with slight modifications to meet current OECD test guideline 473 (OECD, 1997a, 2014b) recommendations. Genipin and gardenia blue were formulated in DMSO and water, respectively; formulations were administered at 1% (DMSO) or 5% (water) of the final culture volume. Based on results of preliminary toxicity tests, the top concentrations of genipin selected for testing were 75 μg/mL for 4-h exposures (±S9) and 50 μg/mL for continuous exposure (–S9); gardenia blue was tested up to 5000 μg/mL for all exposure conditions to meet the recommendation for non-cytotoxic chemicals. In separate experiments, duplicate cultures of exponentially growing cells seeded approximately 23 h earlier at 0.2 × 10⁶ cells/mL in T25 flasks were exposed to various concentrations of genipin, gardenia blue, vehicle or positive control chemical. The final concentration of S9 in the cultures was 2%. Exposure durations were 4 and 20 h –S9 and 4 h +S9. At the end of the 4-h exposure periods, treatment media were replaced with complete medium (–S9); colcemid was added at 0.1 μg/mL 2 h prior to termination of the 20-h culturing period. For each test condition, the frequencies of chromosomal aberrations and mitotic index (percentage of metaphase cells) were determined at the highest 3–4 concentration levels meeting acceptable cytotoxicity criterion. The mitotic index was determined from 1000 cells per replicate culture for the genipin study. Criteria for a valid negative study included that the highest test article concentration evaluated for clastogenic activity must result in ≥50% reduction of viable cell count or the mitotic index, unless precluded by solubility or the use of the maximal concentration (5 mg/mL). Structural and numerical chromosome damage (e.g., chromatid and chromosome gaps and breaks, double minute, dicentric and ring chromosomes and other complex rearrangements) was determined from scoring 100 or 150 metaphase spreads per replicate culture on coded slides at 1000x magnification for the genipin and gardenia blue studies, respectively. If 20 metaphase cells with structural chromosomal damage (excluding gaps) were detected out of the first 50 cells scored, scoring for that culture was terminated. The number of chromosome aberrations (with and without gaps) per cell, and the number of cells with structural damage (no gaps), were tabulated. To assess numerical abnormalities, the number of polyploidy mitoses, including those with endoreduplicated chromosomes, per 100 or 150 metaphase spreads/replicate for the genipin and gardenia blue studies, respectively, was determined (polyploidy index, PI).
2.5. Animal husbandry
Male and female B6C3F1 mice (Charles River Laboratories International, Inc.) were housed in polycarbonate cages with absorbent hardwood bedding and enrichment (nestlets) in an AAALAC-accredited specific pathogen free facility with a 12-h light/12-h dark cycle and provided Certified Purina Pico Chow No. 5002 (Ralston Purina Co., St. Louis, MO) and water ad libitum. All animals were 8–10 weeks of age at the time of treatment. The combined micronucleus/comet studies were approved by the ILS, Inc. Institutional Animal Care and Use Committee, and procedures completed in compliance with the Animal Welfare Act Regulations, 9 CFR 1–4, and the Guide for the Care and Use of Laboratory Animals (Institute of Laboratory Animal Resources, 2011).
2.6. In vivo micronucleus/comet assay experimental design
The in vivo micronucleus and comet studies evaluating genipin in male mice, genipin in female mice, and gardenia blue in male and female mice were separated in time by approximately three years. The studies evaluating genipin were conducted in accordance with the OECD test guideline for the micronucleus assay and recommended procedures for the comet assay current at the time (Burlinson et al., 2007; OECD, 1997c; Tice et al., 2000). The studies evaluating gardenia blue were conducted according to the most recent revision of OECD test guideline 474 and the newly adopted guideline 489 for the comet assay (OECD, 2016a; b). Based on the results of available data, male (6 animals/group) and female (5 animals/group) B6C3F1 mice were administered genipin at 3 (females only), 8, 25, 74, 222, and 667 (males only) mg/kg bw/day formulated in corn oil. Based on results of dose range finder studies, gardenia blue was administered to both male and female B6C3F1 mice (5 animals/group) at 1000, 1500 or 2000 mg/kg bw/day formulated in water. The vehicles (corn oil or water), genipin, gardenia blue and the positive control compound, ethyl methanesulfonate (EMS; Sigma-Aldrich, St. Louis, MO) in 0.9% saline (Ricca Chemical Company, Arlington, TX) at 150 or 200 mg/kg bw/day for genipin and gardenia blue studies, respectively, were administered daily for three days by oral gavage. An additional group of male mice administered cisplatin at 5 mg/kg bw by intraperitoneal injection 24 h prior to scheduled termination (Pesarini et al., 2014; Sayed, 2011; Zamorano-Ponce et al., 2004) was included as a putative concurrent positive control for crosslinking in the gardenia blue study; however, use of cisplatin-exposed animals as a positive control group in the reverse comet assay has not previously been validated. Three hours after the final dose, peripheral blood was collected for flow cytometric analysis of MN; in the gardenia blue studies, bone marrow was harvested and slides prepared for possible MN frequency assessment. Liver, duodenum and glandular stomach tissues (only liver for genipin evaluated in male mice) were collected and single cell suspensions prepared as described previously (Hobbs et al., 2015); cell samples were frozen in liquid N2, and stored at −80 °C until analysis by the comet assay (Recio et al., 2012). Additional sections of tissues were fixed in 10% neutral buffered formalin, trimmed, and paraffin embedded. Liver from male mice administered the vehicle control or 74 mg/kg bw/day genipin were sectioned at 5 μm, stained with hematoxylin and eosin, and microscopically evaluated. Due to a failure to detect a statistically positive response to EMS in stomach of male mice in the initial comet assay, a follow-up study was conducted in which male mice were administered the vehicle, gardenia blue at the limit dose(2000 mg/kg bw/day) and EMS at 200 mg/kg bw/day.
2.7. Erythrocyte micronucleus assay
Processing of peripheral blood samples and flow cytometric analysis of micronucleated reticulocytes (MN-RET) was as described previously (Witt et al., 2008). Cells were fixed and labeled using MicroFlowPLUS Kits (Litron Laboratories, Rochester, NY) according to manufacturer’s directions and analyzed using a FACSCalibur flow cytometer (Becton Dickinson, Sunnyvale, CA). For each peripheral blood sample, 20,000 RET were analyzed to determine the frequency of MN-RET. During analysis of MN-RET, more than 106 mature normochromatic erythrocytes were concurrently enumerated; the percentage of RET (%RET) among total erythrocytes was calculated as a measure of bone marrow toxicity. For each animal in the gardenia blue studies, bone marrow was flushed from one femur using heat-inactivated fetal bovine serum (FBS). The bone marrow suspension was centrifuged for 10 min at 300 × g and the pellet resuspended in 40 μL of FBS by gentle pipetting. For each sample, 5 μL of cell suspension were transferred onto a slide and smeared with the edge of another clean slide. Slides were air dried at room temperature, fixed in 90% methanol for 20 min in a −20 °C freezer, and stored at room temperature. To better interpret the results of the peripheral blood micronucleus assay in female mice, coded bone marrow slides from female mice were scored for MN by individuals without knowledge of their identity. Slides were stained with acridine orange for 5–10 min, rinsed in PBS for 5–15 min and stored at room temperature. The relative proportion of immature RET and mature NCE was determined for each animal by counting 500 erythrocytes (RET plus NCE) by each of two scorers (1000 total); likewise, 2000 RET were scored by each scorer (4000 total) to determine the incidence of MN-RET.
2.8. Comet assay
Slides were prepared as described previously (Hobbs et al., 2015) and stored at room temperature in a desiccator until stained and scored. After staining slides with SYBR Gold™ (Molecular Probes, Invitrogen, Carlsbad, CA), 100 or 150 cells were scored per sample for genipin and gardenia blue studies, respectively, at 200x total magnification without scorer knowledge of sample identity using Comet Assay IV Imaging Software, Version 4.3.1 (Perceptive Instruments, Ltd., Suffolk, UK). The extent of DNA migration was characterized using the % tail DNA endpoint measurement (intensity of all tail pixels divided by the total intensity of all pixels in the comet, expressed as a percentage). According to the test guideline recommendation, the median of the scored comets for each animal was used to calculate the dose group means (the mean of the scored comets was originally used to evaluate the genipin data—see Supplemental Data Table S1).
2.9. Comet and reverse comet assay evaluation of DNA crosslinking
TK6 cells were plated at 2.0 × 10⁵ cells/mL in a final culture volume of 3 mL in 12-well plates. Triplicate wells of cells were exposed to various concentrations of genipin, cisplatin, or EMS for 4 and 24 h at 37 °C in a humidified atmosphere with 6% CO2. For the conventional assay, exposed cells were centrifuged and the pellet resuspended in 3 mL of PBS (phosphate buffered saline, pH 7.4). For the reverse comet assay, exposed cells were centrifuged, washed with PBS, resuspended in TK6 medium and replated in 12-well dishes; styrene oxide was added to all cultures, with the exception of one set of vehicle controls, at a final concentration of 800 μM and cells were returned to the incubator for 1 h. Cells were then centrifuged and resuspended in 3 mL of PBS. For both assays, the resuspended cells were divided into two tubes—2 mL for cytotoxicity assessment and 1 mL for the comet assay—and the tubes centrifuged. The pellet derived from 2 mL of cells was resuspended in 0.3 mL of TK6 medium; the pellet derived from 1 mL of cells was resuspended in 1 mL of mincing solution. The cells in mincing solution were flash frozen and stored in a −80 °C freezer until use. After resuspension, 100 μL of cells in TK6 Medium were added to wells of a 96-well clear bottom white-walled dish, in duplicate, for cytotoxicity assessment using the CellTiter-Fluor™ Cell Viability Assay kit (Promega, Madison, WI) according to the manufacturer’s instructions. Following incubation of the cells with the substrate for 90 min at 37 °C, fluorescence was measured using a Spectromax spectrophotometer (excitation: 400 nm/emission: 505 nm). Viability of the treated cells was normalized against the vehicle control cells. Cell samples in mincing solution were thawed on ice and kept cold during processing. Slides were prepared and scored as described previously (Hobbs et al., 2015) with the exception that electrophoresis was performed for 60 min to optimize for detection of DNA crosslinks.
For evaluation of potential DNA crosslinking induced by genipin, gardenia blue or cisplatin exposure in vivo, slides were prepared as described previously (Hobbs et al., 2015) through the lysing step using frozen liver from female mice in the vehicle and top (222 mg/kg bw/day) genipin groups and frozen liver from male mice in the vehicle, top (2000 mg/kg bw/day) gardenia blue and cisplatin groups. Following lysis, slides were washed briefly in cold water, transferred to glass coplin jars containing water or one of three concentrations of styrene oxide pre-equilibrated to approximately 4 °C, and incubated in a refrigerator for 1 h. After incubation with or without styrene oxide, the slides were rinsed in cold water and processed for the comet assay as before. In a preliminary assessment, 25 cells were scored for each styrene oxide concentration for two of the animals in the vehicle control group to determine which concentration produced the maximum overall level of DNA damage while still being readily scorable; 2.4 mM and 3.6 mM styrene oxide were selected as the concentrations producing the optimal DNA damage response for the genipin and gardenia blue experiments, respectively. Only slides exposed to these concentrations of styrene oxide and slides not exposed to styrene oxide were scored as described above. Since the frozen cells were no longer viable, “hedgehogs” (a cell morphology indicative of extensive DNA damage, sometimes associated with cytotoxicity) could not be generated as a consequence of apoptosis/necrosis resulting from styrene oxide treatment. Therefore, to ensure that any styrene oxide-induced DNA damage was not missed, hedgehogs that could be scored by the imaging software were included in the scoring of comets.
2.10. Data analyses
Statistical analysis of the data was performed using the Statistical Analysis System version 9.2 (SAS Institute, Cary, NC). For in vitro and in vivo micronucleus and comet assays, homogeneity and normality of the vehicle control data were assessed using Levene’s test and the Shapiro-Wilk test, respectively. Data that were not homogeneous and normally distributed were transformed and re-assessed. Homogeneous, normally distributed data were analyzed using one way analysis of variance (ANOVA) and treatment groups compared to the appropriate control group using Dunnett’s multiple comparison test. Dose-dependent changes were evaluated using linear regression. Data sets that could not be transformed to be homogeneous were analyzed using a non-parametric Kruskal-Wallis test and if significant, pair-wise comparisons were performed using a Dunn’s test and/or a Mann-Whitney test; dose dependent changes were evaluated using a Jonckheere Terpstra trend test. A one-tailed t-test was used to compare the dose groups exposed in vivo to genipin or gardenia blue with concurrent vehicle control groups evaluated in the reverse comet assay. For chromosomal aberration assays, mitotic indexes were analyzed for a decrease over vehicle controls using a one-tailed pairwise Student’s t-test and for linear trend with linear regression analysis. Percent structurally damaged cells (without gaps) and polyploidy indexes were analyzed for an increase over vehicle controls using a one-tailed pairwise Fisher’s Exact test and for linear trend using a one-tailed Cochran-Armitage test. For each mammalian cell assay, a one-tailed t-test was used to verify a positive response to the positive control compound (p < 0.05).
For the bacterial mutation assays, a reproducible or dose-dependent 2-fold or greater increase in the number of revertant colonies relative to the vehicle control was considered to be a positive response. Criteria for a positive result in the in vitro and in vivo micronucleus assays and in vivo comet assays were at least one statistically significant dose group (p < 0.05), a dose group falling outside the range of laboratory historical control data, and a statistically significant trend test (p < 0.05). A test was considered equivocal if only one or two of these conditions were met (OECD, 2014a, 2016a; b). In the case of chromosomal aberrations, a statistically significant increase for two or more concentrations in the absence of a significant trend test was considered a positive result (OECD, 2014b). The reverse comet assay was considered positive for chemical-induced DNA crosslinking if chemical exposure led to a statistically significant decrease in % tail DNA compared to the concurrent vehicle control group. An experiment was considered negative if a statistically positive response was not detected.
3. Results
3.1. Bacterial reverse mutation assays
Genipin was tested up to a maximum of 6000 μg/plate. Genipin was cytotoxic at doses of 2000 μg/plate and above in all S. typhimurium strains and at 5000 μg/plate in E. coli WP2 in the absence of metabolic activation. Genipin was not mutagenic in S. typhimurium TA98, TA100, TA1535 or E. coli WP2 uvrA pKM101 with or without metabolic activation or in S. typhimurium TA97a with metabolic activation (Table 1). A dose response without a corresponding doubling of revertants was observed in S. typhimurium TA97a in the absence of metabolic activation; therefore, this response was considered equivocal. Gardenia blue was not cytotoxic or mutagenic at concentrations tested up to 5000 μg/plate in any strain used, either with or without metabolic activation (Table 2).
Table 1. Bacterial reverse mutation assay results of genipin with and without metabolic activation.
| Dose (μg/plate) | Mean revertants/plate (±SD) without rat liver S9 | Mean revertants/plate (±SD) with rat liver S9 | ||||||||
|---|---|---|---|---|---|---|---|---|---|---|
| TA100 | TA98 | TA1535 | TA97a | WP2 uvrA | TA100 | TA98 | TA1535 | TA97a | WP2 uvrA | |
| 0 | 81.0 ± 10.6 | 22.0 ± 6.6 | 12.7 ± 2.3 | 102.0 ± 3.5 | 145.0 ± 13.2 | 96.0 ± 7.0 | 26.7 ± 2.1 | 9.0 ± 4.6 | 146.0 ± 17.5 | 219.0 ± 12.5 |
| 2 | 79.7 ± 8.5 | 24.3 ± 4.0 | 14.0 ± 3.6 | 113.0 ± 7.0 | 135.0 ± 13.1 | 89.0 ± 12.8 | 26.7 ± 2.9 | 8.7 ± 4.5 | 163.7 ± 20.5 | 208.0 ± 13.0 |
| 6.4 | 96.3 ± 4.6 | 24.7 ± 6.1 | 12.0 ± 1.7 | 112.0 ± 7.5 | 161.7 ± 5.5 | 88.3 ± 15.0 | 22.7 ± 5.8 | 8.7 ± 5.0 | 168.0 ± 10.6 | 234.0 ± 9.5 |
| 20 | 104.7 ± 15.5 | 18.0 ± 3.6 | 12.3 ± 2.3 | 118.0 ± 6.2 | 143.7 ± 3.2 | 100.3 ± 10.0 | 28.0 ± 4.4 | 15.3 ± 5.5 | 159.0 ± 31.0 | 212.0 ± 10.8 |
| 64 | 114.0 ± 14.5 | 23.7 ± 2.3 | 17.0 ± 3.6 | 154.3 ± 9.9 | 151.7 ± 24.6 | 106.0 ± 15.1 | 29.0 ± 6.0 | 10.0 ± 6.1 | 154.0 ± 14.2 | 207.7 ± 7.2 |
| 200 | 124.7 ± 27.1 | 28.3 ± 7.4 | 11.0 ± 3.5 | 170.0 ± 4.6 | 159.0 ± 11.5 | 97.3 ± 2.1 | 30.7 ± 6.8 | 9.0 ± 4.0 | 167.3 ± 12.5 | 213.7 ± 6.8 |
| 640 | 23.7 ± 8.6 | 23.7 ± 8.1 | 10.7 ± 4.9 | 159.0 ± 10.1 | 175.5 ± 13.1 | 101.7 ± 7.6 | 32.0 ± 1.7 | 9.0 ± 4.6 | 220.0 ± 12.1 | 210.0 ± 17.3 |
| 2000 | 0 ± 0 | 0.3 ± 0.6 | 0 ± 0 | 1.3 ± 2.3 | 156.0 ± 9.6 | 36.0 ± 32.4 | 4.0 ± 3.5 | 1.0 ± 1.0 | 119.3 ± 32.3 | 232.0 ± 17.5 |
| 5000 | – | – | – | – | 0 ± 0 | – | – | – | – | 135.7 ± 7.2 |
| 6000 | 0 ± 0 | 0 ± 0 | 0 ± 0 | 0 ± 0 | – | 0 ± 0 | 0 ± 0 | 0 ± 0 | 0 ± 0 | – |
| Positive control | 737.3 ± 25.4a | 602.7 ± 40.4b | 716.0 ± 16.8a | 2007.7 ± 103.2c | 2798.0 ± 137.2d | 393.3 ± 6.1e | 1403.0 ± 90.4f | 205.3 ± 4.0g | 1519.3 ± 21.4g | 1920.7 ± 184.5h |
- a
-
Sodium azide administered at 1 μg/plate.
- b
-
2-nitrofluorene administered at 3 μg/plate.
- c
-
ICR191 administered at 0.25 μg/plate.
- d
-
4-nitroquinoline-N-oxide administered at 0.25 μg/plate.
- e
-
Benzo[a]pyrene administered at 2 μg/plate.
- f
-
2-aminoanthracene at 2 μg/plate.
- g
-
2-aminoanthracene at 2.5 μg/plate.
- h
-
2-aminoanthracene at 20 μg/plate.
Table 2. Bacterial reverse mutation assay results of gardenia blue with and without metabolic activation.
| Dose (μg/plate) | Mean revertants/plate (±SD) without rat liver S9 | Mean revertants/plate (±SD) with rat liver S9 | ||||||||
|---|---|---|---|---|---|---|---|---|---|---|
| TA100 | TA98 | TA1535 | TA97a | WP2 uvrA | TA100 | TA98 | TA1535 | TA97a | WP2 uvrA | |
| 0 | 99.7 ± 7.6 | 16.0 ± 3.0 | 17.3 ± 0.6 | 97.0 ± 4.4 | 154.0 ± 18.0 | 100.3 ± 4.9 | 23.7 ± 4.6 | 16.0 ± 1.7 | 157.0 ± 10.6 | 195.0 ± 8.7 |
| 125 | 96.3 ± 6.7 | 20.0 ± 6.6 | 15.7 ± 3.1 | 80.0 ± 13.5 | 175.3 ± 14.4 | 92.5 ± 24.7 | 26.3 ± 3.5 | 17.7 ± 4.5 | 119.3 ± 30 | 185.7 ± 22.9 |
| 250 | 86.3 ± 8.6 | 19.3 ± 3.5 | 15.0 ± 0.0 | 76.3 ± 10.2 | 170.7 ± 22.3 | 92.0 ± 11.3 | 26.7 ± 9.3 | 7.7 ± 2.9 | 152.3 ± 11.6 | 208.0 ± 13.9 |
| 500 | 92.7 ± 6.7 | 20.0 ± 5.2 | 15.7 ± 5.0 | 108.0 ± 20.0 | 170.0 ± 7.9 | 97.3 ± 40.4 | 25.7 ± 7.1 | 17.0 ± 5.6 | 144.0 ± 15.7 | 194.0 ± 4.4 |
| 1250 | 78.7 ± 8.1 | 14.0 ± 2.6 | 17.7 ± 8.0 | 102.0 ± 8.2 | 164.7 ± 20.0 | 99.7 ± 5.0 | 22.3 ± 5.0 | 15.0 ± 7.9 | 149.7 ± 1.2 | 205.3 ± 20.3 |
| 2500 | 89.3 ± 5.7 | 18.7 ± 6.7 | 14.7 ± 2.1 | 82.7 ± 4.0 | 143.7 ± 11.8 | 98.0 ± 13.0 | 24.0 ± 1.0 | 11.0 ± 2.6 | 149.3 ± 3.1 | 163.7 ± 17.9 |
| 5000 | 77.0 ± 23.1 | 14.3 ± 8.5 | 12.0 ± 4.4 | 73.0 ± 2.0 | 99.3 ± 26.0 | 93.7 ± 8.1 | 23.7 ± 0.6 | 11.7 ± 1.2 | 134.3 ± 24.1 | 110.0 ± 32.4 |
| Positive Control | 629.3 ± 44.2a | 443.3 ± 80.7b | 828.3 ± 48.0a | 465.3 ± 81.4c | 2170.3 ± 184.2d | 551.7 ± 68.0e | 1349.3 ± 333.4f | 269.3 ± 27.7g | 986.0 ± 105.7g | 1312.0 ± 209.2h |
- a
-
Sodium azide administered at 1 μg/plate.
- b
-
2-nitrofluorene administered at 3 μg/plate.
- c
-
ICR191 administered at 0.25 μg/plate.
- d
-
4-nitroquinoline-N-oxide administered at 0.25 μg/plate.
- e
-
Benzo[a]pyrene administered at 2 μg/plate.
- f
-
2-aminoanthracene at 2 μg/plate.
- g
-
2-aminoanthracene at 2.5 μg/plate.
- h
-
2-aminoanthracene at 20 μg/plate.
For both studies, the positive control chemicals induced positive responses in all strains, with or without metabolic activation, and the mean number of revertant colonies in the controls were within the reference ranges of the laboratory historical data. Similar results were obtained in preliminary dose finder studies (data not shown), demonstrating the reproducibility of the responses and reinforcing the equivocal test outcome for genipin.
3.2. In vitro micronucleus assays
MN frequency and cell viability data for TK6 cells exposed to genipin are summarized in Table 3. Following 4 h of exposure to genipin in the presence of metabolic activation, concentrations ≥25 μg/mL were excessively cytotoxic and could not be scored. Relative survival at the top two scorable concentrations of 5 and 10 μg/mL was 66.6% and 33.4%, respectively. There was a statistically significant induction of MN in these treatment groups, and a positive trend test. The positive result for the 10 μg/mL group, which fell outside of laboratory historical negative control data, may be confounded by cytotoxicity; the positive result for the 5 μg/mL group was within historical data. Thus, the response for the +S9 condition was equivocal. A steep dose response for cytotoxicity was observed for cells exposed to genipin at concentrations between 5 and 10 μg/mL for 24 h –S9 in an initial test (data not shown); therefore, a follow-up test was performed to better define the response between 4 and 10 μg/mL (Table 3). All concentrations were scorable and the 44.5% relative survival at the top concentration was within the appropriate cytotoxicity range. Statistically significant induction of MN was observed at the top three concentration levels with a corresponding dose-related response. The responses elicited at the top two concentrations were outside of laboratory historical data. Thus, these results met the criteria for a positive test.
Table 3. Micronucleus assay results in TK6 cells exposed to genipin.
| Dose (μg/mL) | Micronucleus Frequency (%)a | Apoptotic/Necrotic Cells (%)a | Relative Survival (%)a |
|---|---|---|---|
| 4 h with S9 | |||
| 0 | 1.03 | 14.2 | 100.0 |
| 2.5 | 1.14 | 14.8 | 85.9 |
| 5 | 1.49b | 20.3 | 66.6 |
| 10 | 2.30b,c | 37.7 | 33.4 |
| 25 | NS | NS | NS |
| 50 | NS | NS | NS |
| 75 | NS | NS | NS |
| CP (12.5) | 9.16b | 34.1 | 41.1 |
| 24 h without S9 | |||
| 0 | 0.49 | 2.4 | 100.0 |
| 4 | 0.58 | 2.7 | 87.9 |
| 6 | 1.07b | 3.2 | 74.1 |
| 8 | 1.71b | 5.5 | 54.9 |
| 10 | 2.81b,c | 8.2 | 44.5 |
| VIN (0.15) | 9.90b | 10.2 | 50.7 |
CP = cyclophosphamide; VIN = vinblastine sulfate.
NS = not scored due to excessive cytotoxicity.
- a
-
Mean.
- b
-
Statistically positive at p < 0.05.
- c
-
Statistically positive trend at p < 0.05.
Micronucleus assay results for TK6 cells exposed to gardenia blue are summarized in Table 4. Following exposure to gardenia blue, cytotoxicity fell within acceptable cytotoxicity criteria (<60%) at all tested concentrations and metabolic conditions. Micronucleus frequencies at all concentrations were not statistically elevated over the vehicle control and there was no indication of a dose response. Thus, gardenia blue tested negative in this assay. Under the various test conditions for both genipin and gardenia blue, exposure to cyclophosphamide, used as a positive control chemical requiring metabolic activation, and vinblastine, a positive control for a direct-acting response, resulted in statistical increases in micronuclei as compared to concurrent vehicle controls.
Table 4. Micronucleus assay results in TK6 cells exposed to gardenia blue.
| Dose (μg/mL) | Micronucleus Frequency (%)a | Apoptotic/Necrotic Cells (%)a | RICC (%)a |
|---|---|---|---|
| 4 h with S9 | |||
| 0 | 0.55 | 2.4 | 100.0 |
| 250 | 0.75 | 2.1 | 70.1 |
| 500 | 0.58 | 2.3 | 104.6 |
| 1250 | 0.68 | 2.4 | 97.9 |
| 2500 | 0.66 | 1.9 | 114.7 |
| 5000 | 0.56 | 2.0 | 96.6 |
| DMSO | 0.54 | 2.4 | 100.0 |
| CP (3) | 2.03b | 5.7 | 31.2 |
| 4 h without S9 | |||
| 0 | 0.54 | 2.1 | 100.0 |
| 250 | 0.55 | 2.4 | 129.0 |
| 500 | 0.56 | 2.1 | 95.6 |
| 1250 | 0.46 | 2.3 | 103.1 |
| 2500 | 0.51 | 1.9 | 106.3 |
| 5000 | 0.58 | 1.9 | 87.7 |
| DMSO | 0.62 | 2.2 | 100.0 |
| VIN (0.003) | 2.38 b | 5.3 | 47.2 |
| 24 h without S9 | |||
| 0 | 0.63 | 2.6 | 100.0 |
| 250 | 0.63 | 2.5 | 104.4 |
| 500 | 0.60 | 2.7 | 98.5 |
| 1250 | 0.66 | 2.7 | 87.7 |
| 2500 | 0.76 | 2.8 | 94.3 |
| 5000 | 0.67 | 2.9 | 95.6 |
| DMSO | 0.30 | 1.7 | 100.0 |
| VIN (0.00075) | 8.37b | 9.7 | 35.1 |
RICC = relative increase in cell count.
DMSO = dimethyl sulfoxide; CP = cyclophosphamide; VIN = vinblastine sulfate.
- a
-
Mean.
- b
-
Statistically positive at p < 0.05.
3.3. In vitro chromosomal aberration assay
Results of studies to assess the potential for genipin and gardenia blue to cause chromosomal aberrations in CHO-WBL cells are summarized in Table 5, Table 6. The percentage of vehicle control cells with structural chromosomal aberrations (excluding gaps) and numerical chromosomal damage observed as polyploidy did not exceed 5%, meeting requirements for a valid test. The positive control chemicals, mitomycin C and cyclophosphamide, induced statistically significant increases in the percentage of metaphase cells with at least one chromosomal aberration (excluding gaps) under all exposure conditions.
Table 5. Chromosomal aberration assay results in CHO cells exposed to genipin.
| Dose (μg/mL) | Viable Cells (x105)/mLa | Mitotic Index (%)a | % Damaged Cellsa | Polyploidy Index (%)a |
|---|---|---|---|---|
| 4 h without S9 | ||||
| 0 | 7.0 | 6.8 | 0.0 | 3.5 |
| 10 | 7.0 | 6.6 | 0.5 | 7.5b |
| 25 | 3.5 | 5.3 | 1.0 | 20.0b |
| 50 | 3.3 | 4.4b | 22.0b,c | 9.0b,c |
| 75 | 3.8 | 0.1b,c | – | – |
| MMC (0.15) | 6.3 | 6.1b | 7.0b | 6.0 |
| 4 h with S9 | ||||
| 0 | 5.0 | 7.6 | 0.0 | 4.0 |
| 10 | 5.4 | 7.7 | 1.0 | 5.0 |
| 25 | 3.1 | 6.6 | 3.5b | 10.0b |
| 50 | 3.2 | 2.0 | 12.5b,c | 8.5b,c |
| 75 | 2.5 | 0.1b,c | – | – |
| CP (5) | 3.8 | 3.1b | 8.0b | 2.0 |
| 20 h without S9 | ||||
| 0 | 6.7 | 6.5 | 0.5 | 4.0 |
| 5 | 7.2 | 6.2 | 0.0 | 5.5 |
| 10 | 5.2 | 5.7 | 2.0 | 19.0b |
| 25 | 4.2 | 5.5 | 3.5b | 5.5 |
| 50 | 2.6 | 0.8b,c | 19.0b,c | 10.0b |
| MMC (0.15) | 5.1 | 5.2b | 29.3b | 3.5 |
Mitotic Index (%) = percent of cells in metaphase.
% Damaged Cells = percent of metaphase cells with at least one structural chromosomal aberration, excluding gaps.
Polyploid Index = percent of polyploid metaphase cells, including endoreduplicated metaphase cells.
MMC = Mitomycin C; CP = Cyclophosphamide.
- a
-
Mean.
- b
-
Significant at p < 0.05.
- c
-
Significant trend at p < 0.05.
Table 6. Chromosomal aberration assay results in CHO cells exposed to gardenia blue.
| Dose (μg/mL) | Viable Cells (x106)/mLa | Mitotic Index (%)a | % Damaged Cellsa | Polyploidy Index (%)a |
|---|---|---|---|---|
| 4 h without S9 | ||||
| 0 | 1.2 | 5.0 | 0.0 | 0.0 |
| 1250 | 1.1 | 5.1 | 0.3 | 0.3 |
| 2500 | 1.2 | 4.8 | 0.3 | 1.3 |
| 5000 | 1.1 | 4.7 | 0.0 | 0.7 |
| MMC (0.15) | 1.1 | 2.5b | 8.0b | 0.0 |
| 4 h with S9 | ||||
| 0 | 1.1 | 3.4 | 0.0 | 0.3 |
| 1250 | 1.2 | 1.1b | 0.0 | 0.3 |
| 2500 | 1.0 | 0.6b | 0.3 | 1.0 |
| 5000 | 1.2 | 0.9b | 0.0 | 0.3 |
| CP (5) | 0.9 | 0.6b | 40.0b | 0.7 |
| 20 h without S9 | ||||
| 0 | 1.5 | 3.7 | 0.0 | 0.7 |
| 1250 | 1.6 | 3.5 | 0.3 | 1.0 |
| 2500 | 1.4 | 1.6b | 0.7 | 0.7 |
| 5000 | 1.3 | 0.9b,c | 1.0c | 0.7 |
| MMC (0.075) | 1.2 | 0.5b | 40.0b | 0.0 |
Mitotic Index (%) = percent of cells in metaphase.
% Damaged Cells = percent of metaphase cells with at least one structural chromosomal aberration, excluding gaps.
Polyploid Index = percent of polyploid metaphase cells, including endoreduplicated metaphase cells.
MMC = Mitomycin C; CP = Cyclophosphamide.
- a
-
Mean.
- b
-
Significant at p < 0.05.
- c
-
Significant trend at p < 0.05.
Genipin was cytotoxic to CHO-WBL cells; the mitotic index was essentially 0 in cells exposed to genipin at 75 μg/mL for 4 h ± S9, and <1% in cells exposed to genipin at 50 μg/mL for 20 h –S9. The 75 μg/mL groups were not evaluated for chromosomal damage due to excessive toxicity. Statistically significant increases in chromosome aberrations were observed at one or more concentrations, including non-cytotoxic concentrations, in a dose-dependent manner under all treatment conditions. Positive groups fell substantially outside of laboratory historical data for the assay. Thus, results met all criteria for a positive test. Significant increases in polyploidy were also observed at one or more concentrations under all treatment conditions, although statistically positive dose responses were measured only after 4-h treatments ±S9.
Exposure to gardenia blue for approximately 4 h +S9 and 20 h –S9 resulted in a significant reduction in mitotic index without interfering with scoring. Gardenia blue did not induce chromosomal damage following exposure for 4 h ±S9. Exposure for 20 h –S9 led to a slight dose-related increase in % damaged cells without a statistically significant increase at any tested concentration. Since all responses fell within the laboratory’s historical vehicle control range, the slight trend is considered to be biologically insignificant. Polyploidy was not significantly increased at any tested concentration. The overall response is considered to be negative under the conditions tested.
3.4. In vivo micronucleus/comet assays
3.4.1. Genipin
There were no statistical effects on body weight of male mice administered genipin evaluated up to 74 mg/kg bw/day (data not shown). Mortality or moribundity was observed in male mice administered genipin at 74 (2/6), 222 (4/6) or 667 (6/6) mg/kg bw/day. Of the four surviving mice in the 74 mg/kg bw/day group, two were normal throughout the study, stained bedding was observed in the cage of a third otherwise normal animal, and the fourth animal was observed with decreased body weight, piloerection, hunched posture, and lethargy with decreased movement on the final day of the study. Histopathologic evaluation of the liver of this mouse revealed karyomegaly and hepatocellular atrophy. Karyomegaly can be a normal finding in mice (Thoolen et al., 2010), while hepatocellular atrophy may be associated with the decreased body weight and abnormal clinical signs observed for this animal.
Results of the micronucleus assays of genipin are summarized in Table 7. A statistically significant increase in the frequency of MN-RET or a dose response was not observed for male mice administered genipin. However, an exceptionally elevated MN-RET frequency (twice that of the EMS group) was measured in one animal in the 74 mg/kg bw/day dose group that caused the group mean to fall outside of laboratory historical data; the mean MN-RET value excluding this animal from the analysis was comparable to those for the other dose groups. Although there was no decrease in % RET, an indicator of suppressed hematopoiesis, it seems likely that the unusually high MN-RET frequency measured in that animal was related to the excessive toxicity it experienced, as indicated by the overt adverse clinical symptoms and hepatocellular atrophy described above. All other surviving animals in this dose group, and animals in the lower dose groups, appeared normal throughout the course of the study and did not exhibit an induction of MN.
Table 7. Combined micronucleus/comet assay results for mice administered genipin.
| Dose (mg/kg bw/day) | N | Micronucleus Assaya | Comet Assay – % Tail DNAa | |||
|---|---|---|---|---|---|---|
| % RET | MN-RET/1000 | Liver | Duodenum | Stomach | ||
| Males | ||||||
| 0 | 6 | 1.88 ± 0.14 | 2.14 ± 0.18 | 3.16 ± 1.18 | – | – |
| 8 | 6 | 1.92 ± 0.20 | 2.46 ± 0.14 | 4.49 ± 2.28 | – | – |
| 25 | 6 | 1.95 ± 0.11 | 2.58 ± 0.26 | 3.05 ± 0.78 | – | – |
| 74 | 4b | 1.83 ± 0.15 | 6.10 ± 3.77c | 2.81 ± 0.61 | – | – |
| EMS | 6 | 1.86 ± 0.14 | 8.51 ± 1.24d | 13.03 ± 0.75d | – | – |
| Females | ||||||
| 0 | 5 | 1.29 ± 0.12 | 2.49 ± 0.13 | 4.42 ± 0.92 | 1.98 ± 0.63 | 3.28 ± 1.26 |
| 3 | 5 | 1.21 ± 0.04 | 3.19 ± 0.29 | – | – | – |
| 8 | 5 | 1.36 ± 0.09 | 2.86 ± 0.32 | – | – | – |
| 25 | 5 | 1.18 ± 0.16 | 2.74 ± 0.21 | 7.77 ± 0.75d | 1.51 ± 0.34 | 1.49 ± 0.61 |
| 74 | 5 | 1.22 ± 0.09 | 3.35 ± 0.50 | 5.19 ± 1.10 | 1.32 ± 0.21 | 2.20 ± 0.99 |
| 222 | 5 | 1.58 ± 0.14 | 3.58 ± 0.23e | 5.91 ± 0.48 | 2.68 ± 0.93 | 1.16 ± 0.46 |
| EMS | 5 | 0.97 ± 0.18 | 12.87 ± 0.45d | 17.83 ± 1.25d | 16.06 ± 0.89d | 17.47 ± 3.82d |
EMS = ethyl methanesulfonate administered at 150 mg/kg bw/day.
- a
-
Group mean ± standard error of the mean.
- b
-
Two mice did not survive to termination.
- c
-
Result confounded by one animal exhibiting signs of severe toxicity; mean excluding this animal = 2.33 ± 0.35.
- d
-
Significant at p < 0.05.
- e
-
Significant trend test at p < 0.05.
The death of two animals in the 74 mg/kg bw/day dose group prior to scheduled termination reduced the total number of analyzed animals below the minimum of five recommended in the regulatory guidelines for both the micronucleus and comet assays. A repeat assay in male mice would necessitate starting at a dose lower than 74 mg/kg bw/day as this concentration was demonstrated to be too toxic. The two lower dose groups (25 and 8 mg/kg bw/day) did not show any evidence of micronuclei induction. Thus, it would be expected that results of a second study in male mice testing genipin starting at the next lower dose of 25 mg/kg bw/day would be negative. Therefore, a follow-up micronucleus/comet assay was conducted in female mice, including evaluation of DNA damage in tissues of the gastrointestinal tract. Female mice administered 222 mg/kg bw/day genipin lost a little weight; all of the animals in this group were hunched and two exhibited decreased movement and piloerection on the final day of the study. At necropsy, the stomachs of this group of animals were observed to be distended and blue in color; the livers of two of these mice were dark in color and one was mottled.
There was a weak but statistically positive dose response in MN-RET, without any positive dose groups, following administration of genipin to female mice. This positive trend appears to be largely driven by the response in the 222 mg/kg bw/day group of animals that exhibited overt signs of toxicity as described above. No decrease in the % RET was measured, indicating a lack of suppression of bone marrow hematopoiesis up to the maximum tolerated dose. The MN-RET values for the 74 and 222 mg/kg bw/day groups fell slightly outside the confidence interval of laboratory historical negative control data. Although these minimal effects may be biologically insignificant, given the lack of a clear cut negative response for either male or female mice, our overall interpretation is that these micronucleus test results are equivocal.
Results of the comet assays of genipin are summarized in Table 7 and Supplemental Data Table S1. Under the conditions of the comet assays conducted in male and female mice, there was no increase in DNA damage measured in liver of male mice, or duodenum or stomach tissue of female mice, administered genipin at any of the tested doses. There was a statistically positive increase in DNA damage measured in the liver of female mice administered the lowest analyzed dose (25 mg/kg bw/day), but not any of the higher doses; all % tail DNA values fell within the range of historical vehicle control data. Administration of EMS as a concurrent positive control elicited induction of MN-RET and DNA damage in all evaluated tissues in all studies of genipin. Given the lack of positive results at higher doses, the lack of a dose response, the fact that all % tail DNA group means fell within the range of laboratory historical data, and that there was no evidence of a DNA damage response in male mice, we do not consider the equivocal result in female mice to be biologically significant.
3.4.2. Gardenia blue
No exposure-related clinical signs were noted during the initial gardenia blue studies or a follow-up limit dose study (described below), and there were no abnormal gross organ observations during necropsy. No effects were observed on the body weight of male mice. Female mice administered 1500 mg/kg bw/day gardenia blue lost slightly less body weight than control mice; no effects of exposure on body weight were observed in a follow up limit dose study (data not shown).
Results of the combined micronucleus/comet assays of gardenia blue are summarized in Table 8. The MN-RET frequency in male mice administered gardenia blue was not significantly different from concurrent vehicle controls. Female mice administered gardenia blue exhibited a statistically positive dose response in MN-RET accompanied by a statistically significant increase in MN-RET at the 2000 mg/kg bw/day dose level; the MN-RET frequencies for 3 of the 5 animals in the statistically positive dose group fell slightly outside of laboratory historical data. To better interpret the equivocal results of the peripheral blood micronucleus assay in female mice, smears prepared from bone marrow harvested from the same female mice were evaluated for MN-RET frequency. There was no evidence of induction of MN-RET measured in the bone marrow. Since the status of erythrocytes in peripheral blood is a gauge of the condition of erythrocytes in the bone marrow, the clearly negative result in the bone marrow effectively negates the equivocal result obtained using peripheral blood. Mice administered EMS, the positive control, exhibited a statistically significant increase in MN-RET frequency in both peripheral blood and bone marrow, demonstrating the ability to detect a positive response in these assays. Therefore, the micronucleus assay was considered to be negative in both male and female mice.
Table 8. Combined micronucleus/comet assay results for mice administered gardenia blue.
| Dose (mg/kg bw/day) | N | MN Assay – Peripheral Blooda,b | MN Assay – Bone Marrowa,c | Comet Assay – % Tail DNAa | ||||
|---|---|---|---|---|---|---|---|---|
| % RET | MN-RET/1000 | % RET | MN-RET/1000 | Liver | Duodenum | Stomachd | ||
| Males | ||||||||
| 0 | 5 | 1.72 ± 0.14 | 3.11 ± 0.25 | – | – | 6.71 ± 1.56 | 7.10 ± 1.78 | 14.87 ± 3.28 |
| 1000 | 5 | 1.39 ± 0.05 | 2.53 ± 0.20 | – | – | 9.50 ± 2.10 | 5.71 ± 0.97 | – |
| 1500 | 5 | 1.71 ± 0.16 | 2.87 ± 0.24 | – | – | 12.09 ± 1.48 | 7.31 ± 1.95 | – |
| 2000 | 5 | 1.49 ± 0.07 | 3.22 ± 0.39 | – | – | 8.57 ± 1.37e | 6.62 ± 2.43 | 15.57 ± 4.82 |
| vEMS | 5 | 0.86 ± 0.07f | 26.54 ± 2.34f | – | – | 30.80 ± 3.05f | 19.34 ± 2.33f | 25.40 ± 2.50f |
| Females | ||||||||
| 0 | 5 | 0.99 ± 0.07 | 2.12 ± 0.23 | 67.6 ± 2.18 | 3.10 ± 0.65 | 12.96 ± 1.34 | 9.94 ± 1.18 | 9.71 ± 4.20 |
| 1000 | 5 | 1.04 ± 0.05 | 2.46 ± 0.21 | 70.3 ± 2.19 | 2.00 ± 0.40 | 11.59 ± 1.93 | 11.69 ± 0.94 | 13.49 ± 6.47 |
| 1500 | 5 | 1.03 ± 0.05 | 2.90 ± 0.26 | 68.3 ± 1.33 | 2.20 ± 0.35 | 12.17 ± 1.34 | 12.02 ± 1.07 | 28.79 ± 7.33 |
| 2000 | 5 | 1.23 ± 0.16 | 3.27 ± 0.30e,f | 65.7 ± 3.49 | 3.05 ± 0.31 | 12.88 ± 1.08 | 10.60 ± 0.85 | 4.25 ± 0.94e |
| EMS | 5 | 0.38 ± 0.11f | 23.36 ± 3.76f | 56.9 ± 6.03 | 31.25 ± 3.68f | 31.51 ± 0.99f | 23.12 ± 0.94f | 36.34 ± 4.34f |
EMS = ethyl methanesulfonate administered at 200 mg/kg bw/day.
- a
-
Group mean ± standard error of the mean.
- b
-
Flow cytometry-based assay.
- c
-
Slide-based assay.
- d
-
Results provided for follow-up limit dose assay for male mice.
- e
-
Significant trend test at p < 0.05.
- f
-
Significant at p < 0.05.
In the comet assay, administration of gardenia blue did not induce DNA damage in duodenum, but resulted in statistically positive trend tests in the liver of male mice and stomach of female mice, even though the top dose group in each case actually had the lowest % tail DNA value of all the gardenia blue dose groups. Although several of the dose groups fell outside of laboratory negative control historical data, there were no statistically positive dose groups. Administration of EMS, the positive control, resulted in a statistically significant increase in % tail DNA in all tissues analyzed, with the exception of the stomach in male mice. The lack of a statistical increase was likely due to the unusually high DNA damage measured in the male vehicle control mice (higher than laboratory historical data; Supplemental Data Table S2). Therefore, a follow-up experiment was conducted to specifically evaluate DNA damage in the stomach of male mice following exposure to the limit dose (2000 mg/kg bw/day) of gardenia blue (Table 8). In this experiment, the levels of DNA damage in mice administered gardenia blue and EMS were comparable to those measured in the initial experiment (Supplemental Data Table S2); however, the level of DNA damage measured in vehicle control mice was lower (within the laboratory historical range) and EMS elicited a statistically positive response. Similar to the initial experiment, there was no induction of DNA damage in the stomach following exposure to gardenia blue. Considering the test in the other gender as a follow up study to an equivocal result, our overall conclusion is that gardenia blue tested negative in the comet assay since the trends were not consistent between the sexes and there was no indication of DNA damage in the liver of female mice or the stomach of male mice administered gardenia blue.
3.5. Comet and reverse comet assay for the evaluation of DNA crosslinking
For the conventional comet assay, TK6 cells were exposed to genipin, cisplatin (a known DNA crosslinking agent), or EMS at various concentrations for 4 or 24 h. Viability was assessed at the time of cell harvest. The electrophoresis time was extended to maximize detection of any reduction in measured DNA damage, indicative of DNA crosslinking. Under these conditions, there appeared to be a dose-dependent decrease in % tail DNA resulting from exposure to the known crosslinking agent, cisplatin, without associated cytotoxicity; however, only the cells exposed to the highest concentration (1600 μM) exhibited a statistically significant decrease in % tail DNA and there was no statistical evidence of a dose response (Fig. 2A). This result underscores the lack of sensitivity of the conventional comet assay for detecting DNA crosslinking. No decrease in % tail DNA was observed following exposure of TK6 cells to genipin for 4 h (Fig. 2C). During scoring of the slides, it was noted that some slides contained cells with extensive DNA damage that was too faint to be detected by the imaging software under the normal scoring conditions; following decoding, these slides were determined to correspond to the top two (667 and 2000 μM) genipin concentrations. Imaging these slides under the microscope without any filter clearly revealed extensive damage (see Fig. S1 in Supplemental Data). The DNA damage observed in cells exposed to 667 and 2000 μM genipin may be related, at least in part, to the cytotoxicity observed at these concentrations (viability corresponding to 73% and 13% of vehicle control cells, respectively). Together, these results do not provide any evidence of DNA crosslinking resulting from exposure to up to 2000 μM genipin for 4 h. Induction of DNA damage by the positive control chemical, EMS, was evident; however, the result was not statistically positive, probably due to the relative lack of response in one of the biological replicates.
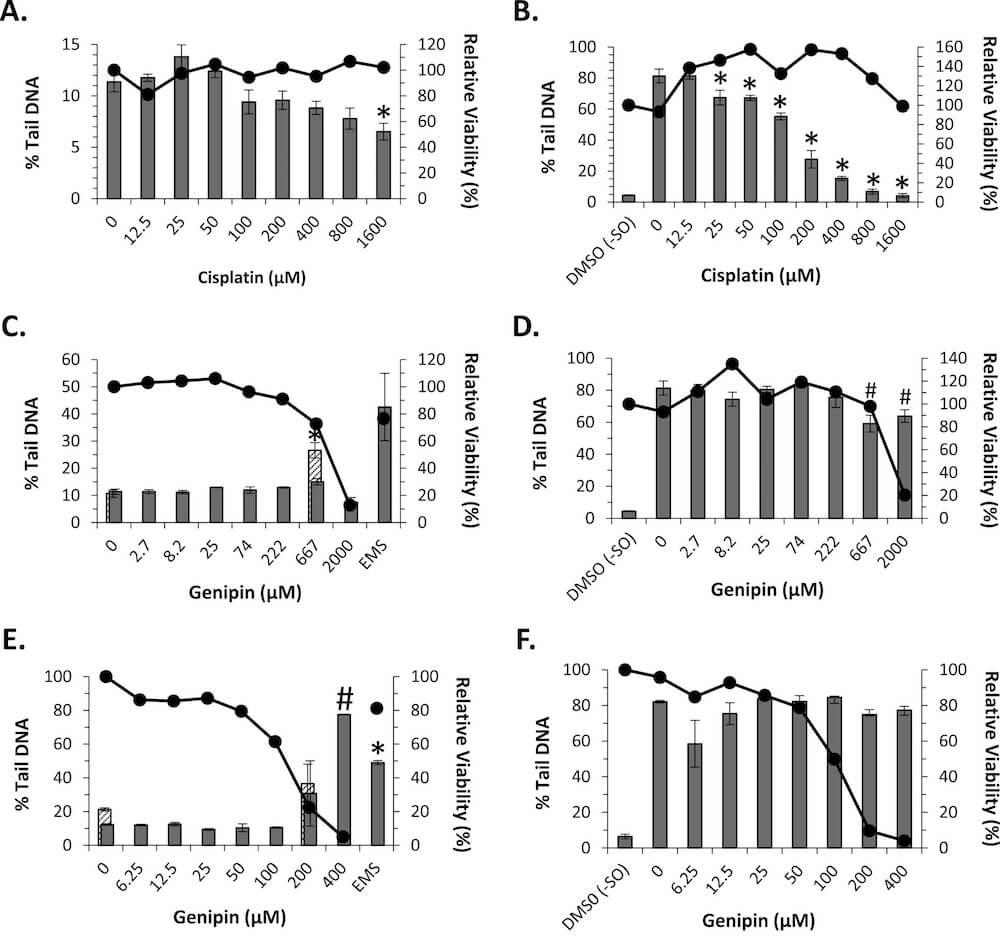
Fig. 2. Dose Response of Cisplatin and Genipin in TK6 Cells in the Conventional and Reverse Comet Assays. Comet assay results (columns) are shown following: 4 h of exposure to cisplatin in (A) conventional and (B) reverse comet assays; 4 h of genipin exposure in (C) conventional and (D) reverse comet assays; and 24 h of genipin exposure in (E) conventional and (F) reverse comet assays. Due to a noticeable scoring artefact (see text), the 0 and 667 μM (C) and 0 and 200 μM (E) genipin slides were reanalyzed without a microscope filter (stippled columns); the 2000 μM (C) and 400 μM (E) genipin slides were not analyzable without the filter. Cell viability at each concentration relative to vehicle controls was assessed using a CellTiter-Fluor™ assay (lines and circles). *Significant decrease compared to vehicle (A, C, E) or styrene oxide (B, D, F) control at p < 0.05. #Significant decrease compared to styrene oxide control at p < 0.05, probably resulting from a scoring artefact (see text).
No decrease in % tail DNA was observed following exposure of TK6 cells to genipin for 24 h (Fig. 2E). Similar to the 4-h experiment, the top two (200 and 400 μM) concentrations of genipin produced DNA damage that was not measured under the normal scoring conditions (Fig. S2 in Supplemental Data). Although analysis of the genipin dose groups using Dunn’s test did not indicate a statistical increase in % tail DNA induced at 400 μM, a follow-up ad hoc pairwise Mann-Whitney test did indicate a statistically positive (p = 0.0404) response for DNA damage at 400 μM as compared to the vehicle control cells. The DNA damage observed following 24 h of exposure to 400, and possibly 200, μM genipin is likely related, at least in part, to the excessive cytotoxicity measured at these concentrations (viability corresponding to 5% and 23% of vehicle control, respectively). There was no evidence of DNA damage or crosslinking induced by genipin at minimally cytotoxic doses.
The reverse comet assay was performed in similar fashion to the conventional comet assay with extended electrophoresis described above except that TK6 cells exposed to genipin or cisplatin were subsequently exposed to styrene oxide or vehicle control for 1 h. In TK6 cells treated with cisplatin for 4 h prior to induction of DNA damage by styrene oxide, there was a dose-dependent (p = 0.0065) decrease in % tail DNA relative to the control cells treated only with styrene oxide (Fig. 2B). Indication of DNA crosslinking was observed at concentrations ranging as low as 25 μM. For cells exposed to genipin for 4 h, no dose-dependent reduction in % tail DNA was observed (p = 0.2562); statistically significant decreases compared to the styrene oxide control cells measured at 667 and 2000 μM (Fig. 2D) were determined to have resulted from a scoring artefact. As compared to styrene oxide treatment alone, more cells with extensive DNA damage were visibly evident following pre-exposure to 2000 μM, and to a lesser extent, 667 μM genipin (See Supplemental Fig. S3), consistent with the results of the conventional comet assay. However, under the scoring criteria used (i.e., exclusion of hedgehogs and cells with ≥90% tail DNA), the % tail DNA values underrepresent the extent of DNA damage induced at these two concentrations. For cells exposed to genipin for 24 h, no statistically significant decreases compared to the styrene oxide control cells were measured (Fig. 2F) and the trend test was negative. These results indicate that a 24-h exposure to genipin did not induce DNA crosslinking in TK6 cells.
The results of a reverse comet assay assessment of crosslinking in the liver of female mice exposed to genipin are summarized in Fig. 3A. Exposure of vehicle control group slides to 2400 μM styrene oxide prior to electrophoresis resulted in a 2.3-fold increase over baseline DNA damage as measured by the % tail DNA endpoint. Similar styrene oxide treatment of slides prepared from liver of animals exposed to 222 mg/kg bw/day genipin resulted in a 1.6-fold increase over baseline damage. There was less DNA damage measured in the genipin dose group following styrene oxide treatment as compared to the vehicle control group; however, the difference between the two groups was not statistically different. Although a direct comparison cannot be made due to different methodology used between the original comet assay and the reverse comet assay (e.g., scoring of “hedgehogs”, 1 h incubation following cell lysis), not surprisingly, the baseline level of DNA damage appears to have increased substantially over the prolonged (>2 years) period of freezer storage. Nevertheless, the inter-animal variability within treatment groups was not excessive and the baseline level of damage in the vehicle control and genipin groups remained similar. These results indicate that, under the test conditions used, genipin exposure does not appreciably lead to DNA crosslinking in the liver of B6C3F1 mice.
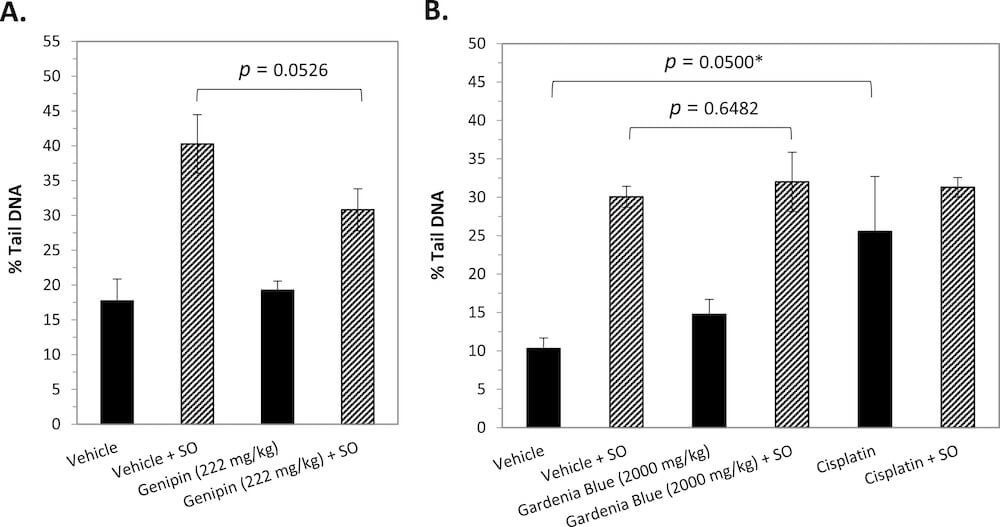
Fig. 3. Assessment of DNA Crosslinking in Liver of B6C3F1 Mice Using a Reverse Comet Assay. The amount of DNA damage in frozen liver cells of (A) female mice administered genipin and (B) male mice administered gardenia blue or cisplatin following in situ exposure to styrene oxide (SO) for 1 h at 4 °C was compared to that in the similarly treated vehicle control groups (stippled bars). The solid bars reflect the baseline level of DNA damage measured on parallel sets of slides not treated with styrene oxide. *One animal exhibited an extremely high number of hedgehogs, unlike the other animals in the group; % tail DNA = 19.0 ± 3.9 and p = 0.0258 when the data point for this animal is excluded.
The results of the reverse comet assay assessment of crosslinking induced by gardenia blue in the liver of male mice are summarized in Fig. 3B. Exposure of slides prepared from liver tissue of male mice to 3.6 mM styrene oxide prior to electrophoresis resulted in an induction of DNA damage over baseline damage for both vehicle control and gardenia blue (2000 mg/kg bw/day) dose groups. There was no indication of in vivo crosslinking as evidenced by the lack of reduction in DNA damage measured in the gardenia blue dose group following styrene oxide treatment as compared to the concurrent vehicle control group. Baseline damage in the cisplatin group was higher than that measured in the vehicle control group, consistent with previous reports (Uno et al., 2015). Although the absolute level of DNA damage in the cisplatin group following styrene oxide treatment was similar to that measured for the vehicle and gardenia blue groups, a much smaller induction of DNA damage was measured relative to that observed for these other groups that might possibly reflect crosslinked DNA.
4. Discussion
Consumer demand for healthier food products is on the rise, including the replacement of artificial food colors with natural color derived from fruits and botanicals. In preparation for the worldwide marketing of gardenia blue as a natural food colorant, gardenia blue and its natural precursor, genipin, were evaluated in a comprehensive battery of GLP-compliant genetic toxicity tests (results summarized in Table 9). The results of our in vitro testing clearly demonstrated the genotoxic potential of genipin and a lack of genotoxicity associated with gardenia blue. The positive result for genipin tested in the in vitro micronucleus assay differs from a negative result using CHO cells reported previously (Tsai et al., 2000). However, our positive results are consistent with a previous report of genipin-induced DNA damaging activity in a B. subtilis Rec assay, and sister-chromatid exchange and tetraploid formation in V79 cells (Ozaki et al., 2002). Our negative results for gardenia blue are consistent with results of genotoxicity testing performed in Japan, often to much higher concentrations than currently recommended by OECD test guidelines (Hachiya and Takizawa, 1992; Hachiya et al., 1985; Ishidate et al., 1981; Yasui et al., 1982; Yoshizumi et al., 1980).
Table 9. Summary of genotoxicity assessments of genipin and gardenia blue.
| Assay | Genipin | Gardenia blue |
|---|---|---|
| bacterial mutagenicity | equivocal | negative |
| in vitro micronucleus | positive | negative |
| in vitro chromosome aberration | positive | negativea |
| in vitro reverse comet | negative | – |
| in vivo micronucleus | equivocal | negativeb |
| in vivo comet | ||
| liver | negativec | negatived |
| duodenum | negative | negative |
| stomach | negative | negativee |
| in vivo reverse comet | negative | negative |
- a
-
Statistically positive trend test is likely not biologically significant.
- b
-
Statistically positive result for female mouse blood was not reproduced in bone marrow.
- c
-
Statistically positive low dose group in female mice is likely not biologically significant.
- d
-
Statistically positive trend test in male mice is likely not biologically significant.
- e
-
Statistically positive trend test in female mice is likely not biologically significant.
Interpretation of results from the in vivo studies of genipin and gardenia blue is less straightforward than for the in vitro studies. OECD test guidelines for the micronucleus and comet assays outline criteria for determination of a negative or positive response, based on statistical analyses (exposure groups compared to vehicle control; dose response), comparison to historical data, and relevant tissue exposure. Results that partially meet criteria for a positive response can be difficult to interpret with confidence. The micronucleus assay of genipin in female mice yielded a statistically equivocal result by virtue of a positive trend test driven by the response in the high dose group of animals that exhibited adverse clinical signs; the complexity of the result was compounded by some MN-RET values falling slightly outside the confidence limits of historical control data. Similarly, in male mice, an exceptionally elevated MN-RET frequency in a single animal that exhibited overt signs of toxicity caused the group mean to fall outside of laboratory historical data. It is quite possible that these marginal responses are linked to toxicity and/or not biologically significant; however, a conservative approach leads to the interpretation that the outcome of the micronucleus tests is equivocal due to the lack of a clear cut negative response in either male or female mice. We conclude the results of the comet assays in these same mice as negative. Overall, no reproducible genotoxic effects occurred in the micronucleus and comet assays at genipin doses reaching toxicity; this suggests that mice detoxify genipin in a way that is not suitably mimicked in cultured cells. For the reasons outlined previously, we also conclude the results of our in vivo micronucleus and comet assays of gardenia blue to be negative.
A requisite for establishing a negative response in an in vivo genotoxicity assay is demonstration of exposure of the evaluated tissue(s) to the test chemical. Genipin is the aglycone cleavage product of the sugar molecule, geniposide. This biotransformation reaction is known to be mediated by β-D-glucosidases in intestinal flora, after which genipin is absorbed into the circulation and transported to the liver (Akao et al., 1994; Meng et al., 2013). Since genipin was directly tested in the in vivo comet assay, circumventing the cleavage reaction, in principle it should be readily absorbed in the stomach and duodenum and directly passed to the liver. Gross observations revealed the stomach and duodenum to be blue in high dose group animals, indicative of genipin contact with protein hydrolysates and/or amino acids; liver tissue was discolored and mottled. Gardenia blue was administered by an oral route consistent with human consumption up to the limit dose required by regulatory guidelines, and tissues expected to be the first site of contact were evaluated for DNA damage. It has been reported that gardenia blue color is very stable at the pH of the gastrointestinal tract and is resistant to degradation by digestive enzymes and bacterial flora as assessed by in vitro absorption, in situ absorption in rats, and histopathology following 5 months of exposure in mice (Touyama et al., 1994); it was speculated that its large molecular weight (∼15600 ± 400) precludes gastrointestinal absorption.
Although the comet assay can detect certain types of DNA damage very well, it is not reliable for the detection of damage by agents known to induce crosslinking (Uno et al., 2015). This raises a potential concern regarding the suitability of the assay to detect DNA damage induced by genipin. To better interpret the negative results in the in vivo comet assays of genipin, we investigated the ability of genipin to induce DNA crosslinking in vitroand in vivo. Since the comet assay using TK6 cells has not been demonstrated to provide a sufficient level of detection of chemicals requiring metabolic activation for DNA damaging activity, and genipin should not require metabolic activation, our experiments were only conducted in the absence of metabolic activation (–S9). Cytotoxicity is considered to be a confounding factor in the determination of genotoxicity using the comet assay. Since genipin exposure stains cells blue, the trypan blue dye exclusion assay commonly used for assessing viability of cultured cells is not suitable for evaluating cells exposed to this chemical. Moreover, it has been reported that relative cell viability determined by trypan blue exclusion just after treatment of TK6 cells provides a less sensitive measure of cytotoxicity as compared to parameters based on cell growth (e.g., relative population doubling, relative increase in cell count) (Kimura et al., 2013). However, for short (e.g., 4 h) assays, measurements based on cell growth are not practical. Therefore, in our experiments, cytotoxicity was assessed using a cell viability assay that measures a protease activity within intact live cells. We used a reverse comet assay in TK6 cells, measuring the ability of test chemical exposure to mitigate DNA damage generated by subsequent treatment with styrene oxide (Jost et al., 2015). As seen previously in human lymphocytes and HeLa cells (Fikrova et al., 2013), cisplatin produced a dose-dependent decrease in DNA damage indicative of DNA cross-linking, whereas there was no effect of genipin in the reverse comet assay. Similarly, there was no statistical evidence of DNA crosslinking in frozen liver samples from mice exposed to genipin evaluated by this method. This suggests that the negative result in the standard comet assay reflects a true negative response, rather than a confounding effect of genipin-induced crosslinking. A satellite group of mice exposed to cisplatin was included in the in vivo comet assay of gardenia blue. The cisplatin dose level was selected following a review of the literature (Pesarini et al., 2014; Sayed, 2011; Zamorano-Ponce et al., 2004). However, no publications were identified to provide guidance for defining a dosing regimen suitable for employing cisplatin as a positive control for detection of DNA crosslinking in mouse liver in an in vivo comet assay. Under the conditions used in the reverse comet assay, baseline damage in the cisplatin group was higher than that measured in the vehicle control group, consistent with previous reports demonstrating that the comet assay can, but perhaps not routinely, detect damage induced by crosslinking agents that produce a spectrum of DNA adducts (Uno et al., 2015). Moreover, the much smaller induction of DNA damage by styrene oxide treatment observed in the cisplatin group as compared to the other groups might possibly signify crosslinked DNA. In contrast, there was no suggestion of crosslinking in the liver tissue examined from mice exposed to gardenia blue.
A 90-day toxicity study with an in utero exposure component was recently conducted in Sprague Dawley rats in preparation for an in utero 12-month chronic toxicity study of gardenia blue (Maronpot et al., in preparation). In that study testing up to 5% gardenia blue colorant in the diet, there were no clinical signs of toxicity, notable alterations of clinical chemistry or histopathology endpoints, or adverse reproductive, developmental, or neurobehavioral effects. The results of the comprehensive testing described here round out the initial GLP-compliant safety assessment of gardenia blue as a food colorant and indicate that consumption of gardenia blue in food products does not pose a genotoxic concern for humans.
Acknowledgements
This work was conducted at ILS, Inc. and funded by the Japan Ministry of Agriculture, Forestry and Fisheries and the Gardenia Blue Interest Group consortium, representing manufacturers of gardenia blue. Maronpot Consulting LLC is a consultant for ILS, Inc. and San-Ei Gen, F.F.I., Inc. ILS, Inc. was responsible for the study design, the collection, analysis, and interpretation of data, and the writing of the final study reports and manuscript. The decision to submit the paper for publication was made by the Gardenia Blue Interest Group consortium. The authors thank Dr. Molly Boyle for providing histopathological assessment of liver tissue. We also acknowledge the contributions of other staff members at ILS who provided technical, animal care, formulation, dosing, necropsy, analytical chemistry, and quality assurance services in support of these studies.
References
- Akao et al., 1994
-
T. Akao, K. Kobashi, M. Aburada Enzymic studies on the animal and intestinal bacterial metabolism of geniposideBiol. Pharm. Bull., 17 (1994), pp. 1573-1576
- Ames et al., 1975
-
B.N. Ames, J. McCann, E. Yamasaki Methods for detecting carcinogens and mutagens with the Salmonella/mammalian-microsome mutagenicity testMutat. Res., 31 (1975), pp. 347-364
- Avlasevich et al., 2006
-
S.L. Avlasevich, S.M. Bryce, S.E. Cairns, S.D. Dertinger In vitro micronucleus scoring by flow cytometry: differential staining of micronuclei versus apoptotic and necrotic chromatin enhances assay reliabilityEnviron. Mol. Mutagen., 47 (2006), pp. 56-66
- Bryce et al., 2007
-
S.M. Bryce, J.C. Bemis, S.L. Avlasevich, S.D. Dertinger In vitro micronucleus assay scored by flow cytometry provides a comprehensive evaluation of cytogenetic damage and cytotoxicityMutat. Res., 630 (2007), pp. 78-91
- Burlinson et al., 2007
-
B. Burlinson, R.R. Tice, G. Speit, E. Agurell, S.Y. Brendler-Schwaab, A.R. Collins, P.Escobar, M. Honma, T.S. Kumaravel, M. Nakajima, Y.F. Sasaki, V. Thybaud, Y. Uno, M. Vasquez, A.Hartmann Fourth international workgroup on genotoxicity testing: results of the in vivo comet assay workgroupMutat. Res., 627 (2007), pp. 31-35
- EFSA, 2011
-
EFSA Scientific opinion on genotoxicity testing strategies applicable to food and feed safety assessmentEFSA J, 9 (2011), p. 2379
- FDA, 2000a
-
FDA FDA (U.S. Food and Drug Administration, Office of Food Additive Safety)(2000)Redbook 2000: Toxicological Principles for the Safety Assessment of Food Ingredients. IV.C.1.a. Bacterial Reverse Mutation Test
- FDA, 2000b
-
FDA FDA (U.S. Food and Drug Administration, Office of Food Additive Safety)(2000)Redbook 2000: Toxicological Principles for the Safety Assessment of Food Ingredients. IV.C.1.b. In Vitro Mammalian Chromosomal Aberration Test
- FDA, 2000c
-
FDA FDA (U.S. Food and Drug Administration, Office of Food Additive Safety)(2000)Redbook 2000: Toxicological Principles for the Safety Assessment of Food Ingredients. IV.C.1.d. Mammalian Erythrocyte Micronucleus Test
- Fikrova et al., 2013
-
P. Fikrova, R. Stetina, M. Hrnciarik, V. Rehacek, P. Jost, M. Hronek, Z. Zadak Detection of DNA crosslinks in peripheral lymphocytes isolated from patients treated with platinum derivates using modified comet assayNeoplasma, 60 (2013), pp. 413-418
- Gatehouse et al., 1994
-
D. Gatehouse, S. Haworth, T. Cebula, E. Gocke, L. Kier, T. Matsushima, C. Melcion, T.Nohmi, T. Ohta, S. Venitt, et al. Recommendations for the performance of bacterial mutation assaysMutat. Res., 312 (1994), pp. 217-233
- Hachiya and Takizawa, 1992
-
N. Hachiya, Y. TakizawaMicronucleus Test on Natural Food Additives. Mutagenicity Test, 1 (1992), p. 13
- Hachiya et al., 1985
-
N. Hachiya, Y. Takizawa, T. Kawamura, C. Tatemo, Y. Sakabe, M. Asanoma, M. Noda, M.Ishizaki, T. Ishibashi, K. Kuroda II. Summary of acute toxicity and various mutagenicity tests on natural additives (1981 to 1983)Toxicol Forum, 8 (1985), pp. 91-105
- Hobbs et al., 2012
-
C.A. Hobbs, C. Swartz, R. Maronpot, J. Davis, L. Recio, S.M. Hayashi Evaluation of the genotoxicity of the food additive, gum ghattiFood Chem. Toxicol., 50 (2012), pp. 854-860
- Hobbs et al., 2015
-
C.A. Hobbs, C. Swartz, R. Maronpot, J. Davis, L. Recio, M. Koyanagi, S.M. Hayashi Genotoxicity evaluation of the flavonoid, myricitrin, and its aglycone, myricetinFood Chem. Toxicol., 83 (2015), pp. 283-292
- Institute of Laboratory Animal Resources, 2011
-
Institute of Laboratory Animal Resources Guide for the Care and Use of Laboratory Animalsthe National Academies Press, Washington, DC (2011)
- Ishidate et al., 1981
-
M. Ishidate, T. Sofuni, K. Yoshikawa Mutagenicity of Food Additives(1981)No. 2 Mutation and Toxicity, 4th Series 80
- Jost et al., 2015
-
P. Jost, H. Svobodova, R. Stetina Induction and repair of DNA cross-links induced by sulfur mustard in the A-549 cell line followed by a comet assayChem. Biol. Interact., 237 (2015), pp. 31-37
- Kimura et al., 2013
-
A. Kimura, A. Miyata, M. Honma A combination of in vitro comet assay and micronucleus test using human lymphoblastoid TK6 cellsMutagenesis, 28 (2013), pp. 583-590CrossRefView Record in Scopus
- Koo et al., 2006
-
H.J. Koo, K.H. Lim, H.J. Jung, E.H. Park Anti-inflammatory evaluation of gardenia extract, geniposide and genipinJ. Ethnopharmacol., 103 (2006), pp. 496-500
- Maron and Ames, 1983
-
D.M. Maron, B.N. Ames Revised methods for the Salmonella mutagenicity testMutat. Res., 113 (1983), pp. 173-215
- Maronpot et al., in preparation
- Maronpot, R.R., Davis, J., Moore, R., Koyanagi, M., Nyska, A., Hayashi, S., Gardenia Blue Ninety-Day Rat Study with In Utero Exposure (in preparation).
- McKenna et al., 2003
-
D.J. McKenna, M. Gallus, S.R. McKeown, C.S. Downes, V.J. McKelvey-Martin Modification of the alkaline Comet assay to allow simultaneous evaluation of mitomycin C-induced DNA cross-link damage and repair of specific DNA sequences in RT4 cellsDNA Repair, 2 (2003), pp. 879-890
- Meng et al., 2013
-
S. Meng, J. Peng, Q. Feng, J. Cao, Y. Hu The role of genipin and geniposide in liver diseases: a reviewAltern. Integr. Med., 2 (2013), p. 117
- OECD, 1997a
-
OECDOECD Guideline for the Testing of Chemicals: in Vitro Mammalian Chromosome Aberration Test, vol. 473(1997)
- OECD, 1997b
-
OECDOECD Guideline for the Testing of Chemicals: Bacterial Reverse Mutation Test, vol. 471 (1997)
- OECD, 1997c
-
OECDOECD Guideline for the Testing of Chemicals: Mammalian Erythrocyte Micronucleus Test, vol. 474 (1997)
- OECD, 2010
-
OECDOECD Guideline for the Testing of Chemicals: in Vitro Mammalian Cell Micronucleus Test, vol. 487 (2010)
- OECD, 2014a
-
OECDOECD Guideline for the Testing of Chemicals: in Vitro Mammalian Cell Micronucleus Test, vol. 487 (2014)
- OECD, 2014b
-
OECDOECD Guideline for the Testing of Chemicals: in Vitro Mammalian Chromosomal Aberration Test, vol. 473(2014)
- OECD, 2016a
-
OECDOECD Guideline for the Testing of Chemicals: in Vivo Mammalian Alkaline Comet Assay, vol. 489 (2016)
- OECD, 2016b
-
OECDOECD Guideline for the Testing of Chemicals: Mammalian Erythrocyte Micronucleus Test, vol. 474 (2016)
- Ozaki et al., 2002
-
A. Ozaki, M. Kitano, N. Furusawa, H. Yamaguchi, K. Kuroda, G. Endo Genotoxicity of gardenia yellow and its componentsFood Chem. Toxicol., 40 (2002), pp. 1603-1610
- Pant et al., 2015
-
K. Pant, N. Roden, C. Zhang, S. Bruce, C. Wood, K. Pendino Modified in vivo comet assay detects the genotoxic potential of 14-hydroxycodeinone, an alpha,beta-unsaturated ketone in oxycodoneEnviron. Mol. Mutagen., 56 (2015), pp. 777-787
- Pesarini et al., 2014
-
J.R. Pesarini, S.G. Victorelli, A.P. Vicentini, L.K. Ferreira, M.O. Mauro, R. Matuo, J.R.Oliveira, A.C. Antoniolli, M.S. Mantovani, R.J. Oliveira Antigenotoxic and antimutagenic effects of glutamine supplementation on mice treated with cisplatinGenet. Mol. Res., 13 (2014), pp. 4820-4830
- Recio et al., 2012
-
L. Recio, G.E. Kissling, C.A. Hobbs, K.L. Witt Comparison of Comet assay dose-response for ethyl methanesulfonate using freshly prepared versus cryopreserved tissuesEnviron. Mol. Mutagen., 53 (2012), pp. 101-113
- Sayed, 2011
-
H.M. Sayed Investigation of the protective effect of Echinacea extract on cisplatin-induced DNA damage, chromosomal aberrations and micronuclei formation in miceJ. Am. Sci., 7 (2011), pp. 1234-1239
- Sundararaj et al., 2017
-
S. Sundararaj, P. Slusarewicz, M. Brown, T. Hedman Genipin crosslinker releasing sutures for improving the mechanical/repair strength of damaged connective tissueJ. Biomed. Mater. Res. B Appl. Biomater., 105 (2017), pp. 2199-2205
- Sung et al., 1999
-
H.W. Sung, D.M. Huang, W.H. Chang, R.N. Huang, J.C. Hsu Evaluation of gelatin hydrogel crosslinked with various crosslinking agents as bioadhesives: in vitro studyJ. Biomed. Mater. Res., 46 (1999), pp. 520-530
- Tanaka et al., 2009
-
M. Tanaka, M. Yamazaki, K. Chiba Neuroprotective action of genipin on tunicamycin-induced cytotoxicity in neuro2a cellsBiol. Pharm. Bull., 32 (2009), pp. 1220-1223
- Thoolen et al., 2010
-
B. Thoolen, R.R. Maronpot, T. Harada, A. Nyska, C. Rousseaux, T. Nolte, D.E. Malarkey, W.Kaufmann, K. Kuttler, U. Deschl, D. Nakae, R. Gregson, M.P. Vinlove, A.E. Brix, B. Singh, F. Belpoggi, J.M. Ward Proliferative and nonproliferative lesions of the rat and mouse hepatobiliary systemToxicol. Pathol., 38 (2010), pp. 5S-81S
- Tice et al., 2000
-
R.R. Tice, E. Agurell, D. Anderson, B. Burlinson, A. Hartmann, H. Kobayashi, Y. Miyamae, E.Rojas, J.C. Ryu, Y.F. Sasaki Single cell gel/comet assay: guidelines for in vitro and in vivo genetic toxicology testingEnviron. Mol. Mutagen., 35 (2000), pp. 206-221
- Touyama et al., 1994
-
R. Touyama, H. Inouye, H. Sezaki Average molecular weight and gastro-intestinal absorption of a natural food color Gardenia BlueEisei Kagaku, 40 (1994), pp. 259-265
- Tsai et al., 2000
-
C.C. Tsai, R.N. Huang, H.W. Sung, H.C. Liang In vitro evaluation of the genotoxicity of a naturally occurring crosslinking agent (genipin) for biologic tissue fixationJ. Biomed. Mater. Res., 52 (2000), pp. 58-65
- Uno et al., 2015
-
Y. Uno, H. Kojima, T. Omori, R. Corvi, M. Honma, L.M. Schechtman, R.R. Tice, C. Beevers, M.De Boeck, B. Burlinson, C.A. Hobbs, S. Kitamoto, A.R. Kraynak, J. McNamee, Y. Nakagawa, K. Pant, U.Plappert-Helbig, C. Priestley, H. Takasawa, K. Wada, U. Wirnitzer, N. Asano, P.A. Escobar, D. Lovell, T.Morita, M. Nakajima, Y. Ohno, M. Hayashi JaCVAM-organized international validation study of the in vivo rodent alkaline comet assay for detection of genotoxic carcinogens: II. Summary of definitive validation study resultsMutat. Res., 786–788 (2015), pp. 45-76
- Witt et al., 2008
-
K.L. Witt, E. Livanos, G.E. Kissling, D.K. Torous, W. Caspary, R.R. Tice, L. Recio Comparison of flow cytometry- and microscopy-based methods for measuring micronucleated reticulocyte frequencies in rodents treated with nongenotoxic and genotoxic chemicalsMutat. Res., 649 (2008), pp. 101-113
- Yamamoto et al., 2000
-
M. Yamamoto, N. Miura, N. Ohtake, S. Amagaya, A. Ishige, H. Sasaki, Y. Komatsu, K.Fukuda, T. Ito, K. Terasawa Genipin, a metabolite derived from the herbal medicine Inchin-ko-to, and suppression of Fas-induced lethal liver apoptosis in miceGastroenterol., 118 (2000), pp. 380-389
- Yamazaki et al., 2001
-
M. Yamazaki, N. Sakura, K. Chiba, T. Mohri Prevention of the neurotoxicity of the amyloid beta protein by genipinBiol. Pharm. Bull., 24 (2001), pp. 1454-1455
- Yan et al., 2010
-
L.P. Yan, Y.J. Wang, L. Ren, G. Wu, S.G. Caridade, J.B. Fan, L.Y. Wang, P.H. Ji, J.M. Oliveira, J.T. Oliveira, J.F. Mano, R.L. Reis Genipin-cross-linked collagen/chitosan biomimetic scaffolds for articular cartilage tissue engineering applicationsJ. Biomed. Mater. Res., 95 (2010), pp. 465-475
- Yasui et al., 1982
-
Y. Yasui, N. Takeda, N. Henmi, Y. Tani Mutagenicity of commercial natural food colorShokuhin Eiseigaku Zasshi, 23 (1982), pp. 86-90
- Ye et al., 2018
-
D. Ye, L. Zhang, Weidong Fan, X. Zhang, E. Dong Genipin normalizes depression-like behavior induced by prenatal stress through inhibiting DNMT1Epigenetics (2018), 10.1080/15592294.2018.1450033
- Yoo et al., 2011
-
J.S. Yoo, Y.J. Kim, S.H. Kim, S.H. Choi Study on genipin: a new alternative natural crosslinking agent for fixing heterograft tissueKorean J. Thorac. Cardiovasc. Surg., 44 (2011), pp. 197-207
- Yoshizumi et al., 1980
-
S. Yoshizumi, H. Okuyama, R. Toyama Physiochemical characteristics of gardenia enzyme-treated natural colorantsShokuhin Kogyo Gakkaishi, 23 (1980), p. 41
- Zamorano-Ponce et al., 2004
-
E. Zamorano-Ponce, J. Fernandez, G. Vargas, P. Rivera, M.A. Carballo Protective activity of cedron (Aloysia triphylla) infusion over genetic damage induced by cisplatin evaluated by the comet assay techniqueToxicol. Lett., 152 (2004), pp. 85-90