Available imaging systems for use in preclinical toxicology studies increasingly show utility as important tools in the toxicologic pathologist’s armamentarium, permit longitudinal evaluation of functional and morphological changes in tissues, and provide important information such as organ and lesion volume not obtained by conventional toxicology study parameters. Representative examples of practical applications in toxicology research and preclinical studies are presented for ultrasound, PET/SPECT, optical, MRI and MALDI-MSI imaging. Some of the challenges for making imaging systems GLP-compliant for regulatory submission are presented. Use of imaging data on case-by-case basis as part of safety evaluation in regulatory submissions is encouraged.
Introduction
The use of non-invasive in vivo imaging and the option of using ex vivo imaging of fresh and fixed specimens provide a unique adjunct to conventional histopathology evaluation in preclinical animal studies. The number of available imaging methods has increased in recent years, and include ultrasound, optical imaging, positron emission tomography (PET), single photon emission computed tomography (SPECT), computed tomography (CT) and magnetic resonance imaging (MRI). Images provide detailed morphological and functional insights in addition to 2D, 3D and 4D quantitative data on progression and regression of lesions in preclinical disease models and in conventional toxicity and carcinogenicity studies. The aim of this opinion paper is to provide a brief overview of imaging modalities with examples applicable to toxicologic pathology and our recommendations for regulatory submission of imaging data. Representative imaging applications have been selected from an International Academy of Toxicologic Pathology educational course presented at the 13th European Congress of Toxicologic Pathology in Surrey, UK, September 2015.
Overview of selected imaging modalities useful in preclinical studies
Ultrasound
Ultrasound as an imaging modality utilizes high frequency sound waves that travel through tissues, organs and the body to produce images. A transducer (probe) placed against a body converts electrical signals to sound waves, sends them into the body, and the sound waves that are reflected back are turned into electrical signals for processing by a computer to generate an image. The pulses are sent into the animal at recorded time intervals. The distance and direction of the reflected return echo and its time of arrival back to the transducer permits the construction of a two-dimensional image of internal structures in the animal. Resolution increases while depth of penetration decreases at higher frequencies. Use of high frequency sound waves permits real-time monitoring of blood flow. Gas-filled microbubbles can be used to increase the signal when imaging blood flow. Attaching specific proteins to microbubbles (such as antibodies directed against endothelial cell proteins) allows ultrasound to be used to target specific intravascular biochemical processes (Kiessling et al., 2012). Advantages of ultrasound include relative low cost, portability of equipment, good temporal resolution, good safety profile and excellent sensitivity when microbubbles are used. Limitations are poor imaging of bone and airand limits on depth penetration.
PET and SPECT
Positron emission tomography (PET) and single-photon emission tomography (SPECT) utilize radionuclides to allow study of biochemical changes and levels of molecular targets in living animals (Khalil et al. 2011; Yao et al. 2012; Vaquero and Kinahan 2015). For PET to work well one must identify and produce a radiolabeled imaging agent that is specific and selective for the target of interest. A common PET radionuclide is 18F with a half-life of just under two hours. Other radionuclides include 64Cu, 76Br, and short-lived radionuclides 11C, 13N and 15O. A small quantity of the specific radiolabeled agent is given intravenously to the test subject with subsequent tracing of its distribution in the body using a PET camera. The short-lived radionuclide is generated by a cyclotron and decay of the radionuclide occurs by positron emission and subsequent collision of the positron with an electron. Each collision (annihilation) generates two photons that have significantly higher energy (511 keV) than conventional X-rays. A ring-like detector surrounding the subject detects annihilation events and, after detector normalization and other corrections, converts their electrical signal to tomographic images.
Primary use of PET in the clinic is to image cancer most often using 18F-labeled glucose. The assumption is that the metabolic demands of the cancer cells exceed that of normal cells and 18F-glucose will preferentially localize in the cancer cells. Preclinical use of PET is in basic research and in rodent models to investigate mechanism of human disease (Yao et al. 2012). Miniaturized PET scanners for preclinical use have a relatively low spatial resolution of 1 to 2 mm (Moses 2011) but a high sensitivity.
SPECT uses radionuclides that decay with emission of single gamma rays. Typical radionuclides include 99mTc, 123I and 111In and a gamma camera that rotates around the subject is used to capture data from differing positions to allow tomographic reconstruction. Technical implementation (use of a collimator) to cancel out photons that are spatially uninformative can markedly decrease the sensitivity of SPECT in contrast to PET but sensitivity can be increased using micro-pinhole apertures to maintain sensitivity with reasonable spatial resolution. Miniaturized SPECT instruments are available for preclinical studies and have been used for imaging cancer xenografts in mice, rat hearts following ischemia-reperfusion, and for imaging dopamine transporters in rat brain (Scherfler et al., 2002). New versions of SPECT instrumentation for preclinical use have been developed with spatial resolutions of less than a millimeter (van der Have et al., 2009).
The advantage of PET and SPECT is that they detect biochemical changes that typically precede anatomical changes (Bernsen et al. 2014; Franc et al. 2008). Another advantage is the possibility of continuous acquisition of scan data from a radionuclide or radionuclide-labeled experimental substance. Temporal data may be acquired in the form of a dynamic scan. For example, an uptake of a specific radiolabeled antibody-drug conjugate by the tumor can be recorded at multiple time points after the injection, including minutes after the drug delivery, followed by hours and days post-injection in the same animal – providing data which are impossible to obtain using other methods (ter Weele et al., 2015).
A major limitation of PET and SPECT is poor anatomical localization. The lack of an anatomical reference frame is easily overcome by combining PET or SPECT with CT or MRI (Chatziioannou 2005; Shao et al. 1997). The radiation exposure safety concern of using radionuclide imaging for PET and SPECT limits clinical use but is of less concern for preclinical studies provided care is taken regarding exposure of preclinical technical staff.
Optical fluorescence and bioluminescence
Optical imaging, a technique for non-invasively looking inside the body, measures light produced by optical reporters that are visualized through the tissues (typically the skin) of a live animal (Dufort et al. 2010). This imaging platform allows monitoring of function in its natural structural context. There are two broad categories of optical imaging: fluorescence and bioluminescence. Fluorescent technology uses non-ionizing visible, ultraviolet, or infrared light and the special properties of photons to obtain detailed images of organs, tissues, cells, and even molecules. Optical imaging is useful for visualizing soft tissues and takes advantages of different colors of light to simultaneously measure multiple features in an organ or tissue. Bioluminescence relies on introduction of one of several luciferase enzymes into the subject that then interact with its substrate to produce photons of visible light (Sadikot and Blackwell 2005). Both are cost-effective, non-invasive, sensitive, physiological, and high throughput with spatial and temporal resolutions up to 0.25 mm, and can be designed to target a specific protein or pathway of interest. The primary limitation of optical imaging is its shallow depth of penetration limiting its use to visualize internal organs in animals larger than rodents. Novel optical imaging techniques are constantly evolving providing capability to monitor dynamic functional processes at the cellular and molecular level in biological systems and the whole animal. Different varieties of optical, in vivo imaging modalities include optical coherence tomography (Vakoc et al., 2009, Wenzel et al., 2015), photo-acoustic microscopy (Stein et al., 2009), photo-acoustic tomography (Burton et al., 2013, Hudson et al., 2014), multi-photon microscopy (Breckwoldt et al., 2014, Harb et al., 2013), hybrid methods such as laser speckle and fluorescence (Kalchenko et al., 2011, Kalchenko et al., 2010, Towle et al., 2012, Zhongchan et al., 2013), and bioluminescence (Corson et al., 2014, Hirano, 2016) imaging.
CT or CAT- Computed Tomography (Computer-Aided Tomography or Computed Axial Tomography)
Computed tomography uses X-ray imaging of sections or slices (tomography) through the body or a specific tissue to produce a 3-D image of the subject being imaged. CT is basically an anatomic imaging process where the X-ray source is coupled to a detector array and both rotate around the animal. Tissues that strongly absorb X-rays such as bone show up as white, air shows up as black, with soft tissues showing up in shades of gray. The degree of X-ray attenuation by different tissue components is assigned Hounsfield units (HUs) based on their differences in density and composition. Software automatically assigns HUs to every voxel on the CT scan to assist in image interpretation. An iodinated contrast agent can be used during CT imaging to improve spatial resolution and soft tissue contrast. Scaled-down versions of hospital CT scanners are used in preclinical research for small animals, including invertebrates.
Computed tomography allows for rapid acquisition time and high spatial resolution. Micro-CT imaging systems used for preclinical studies offer resolutions as low as 3.25-9 µm (Lombardi et al., 2014; Rueckel et al., 2014). There is essentially limitless depth of penetration. Technical advances in X-ray detection and use of helical scanning and multi-detector systems offer increasingly lower levels of radiation to obtain suitable images. However, exposure to radiation remains a limitation in clinical applications. While soft tissue contrast can be enhanced by use of iodinated contrast agents, soft tissue detail is less than that from MRI. CT remains an important and highly efficient preclinical imaging modality and when combined with PET, SPECT, optical or MRI modalities provides an anatomical reference frame for these other imaging modalities. Numerous examples of CT imaging applications in toxicologic pathology are available in the published literature (Badea et al., 2004; Badea et al., 2005; Vasquez et al., 2013; van Deel et al., 2016; Solomon et al., 2016; Ashton et al., 2015; Brown et al., 2008; Martiniova et al., 2010; Wang et al., 2016; Cavanaugh et al., 2004; Wise et al., 2010).
MRI – Magnetic Resonance Imaging
MRI uses a powerful magnet and radio frequency (RF) energy to image atomic nuclei within the body. It is based on the constant angular momentum of protons and neutrons as they spin about their axes. In addition to their angular momentum, these nuclear particles have a small magnetic field called a magnetic moment. Both the angular momentum and the magnetic moment are vector quantities and, thus, have directionality and spin or wobble features like the wobble of a spinning toy top. When placed in a powerful magnetic field such as in an MRI magnet, these nuclear particles align either parallel or anti-parallel to the MRI magnetic field, absorb energy when aligned by a pulse from one of the MRI magnet coils, and return the absorbed energy as RF pulses, called relaxation, while returning to their normal alignment where an additional gradient coil locates the X, Y and Z orientation of the tissue MR signal after each magnetic pulse from the MR instrument.
The most abundant atomic nucleus in the body is the hydrogen proton, 1H. Thus, it is the most commonly used nucleus for MRI. 1H imaging is dependent upon the concentration of 1H, its degree of polarization, and its gyromagnetic properties. 1H anatomic images are based on the hydrogen in tissue water. MR imaging can be adapted to use other less abundant atomic nuclei, including 31P, 13C, 23Na, 19F and 17O2, as well as hyperpolarized nuclei such as He. A variety of pulse sequences, timing variations, and image acquisition parameters allow capture of two major types of relaxation as the atomic nuclei return to their normal equilibrium. The two types of relaxation are called spin-lattice (longitudinal) and spin-spin (transverse) and the images are generated due to tissue differences in the longitudinal (referred to as T1) and transverse (referred to as T2) relaxation times. By varying the timing parameters of RF pulses (pulse sequences), an acquired image can be either T1 or T2 weighted to enhance contrast of specific tissue pathologies.
A variety of MRI techniques with and without use of MRI contrast agents or super-paramagnetic nanoparticles permit assessment of dynamics of blood flow, oxygen status in areas of perfusion, degree of tissue cellularity, areas of necrosis, and inflammation. Functional MRI (fMRI) can identify functional versus dysfunctional areas in the brain based on an increase in oxygenated blood in areas of increased neural activity. MRI soft tissue anatomy is excellent with resolutions on the order of 25 to 100 µm in preclinical animal studies. MRI is a powerful non-invasive method for assessment of phenotypes and therapeutic efficacy in animal models of disease used in preclinical research and drug development. In vivo MRI provides an opportunity for longitudinal evaluation of tissue changes and phenotypic expression in experimental animal models to monitor progression, regression, and therapeutic responses non-invasively. Ex vivo MRI of formalin-fixed specimens permits a thorough examination of multiple digital slides while leaving the specimen intact for subsequent conventional H&E histology of regions of interest (Nyska et al., 2014; Tempel-Brami et al., 2015; Ramot et al. 2017a; Ramot et al., 2017b).
For conventional MRI systems, equipment acquisition, operation and maintenance are relatively expensive and are limited to institutional facilities where these systems can be isolated for safety reasons. These limitations have recently been overcome with the development of more compact MRI systems that are designed for operation in conventional laboratories without the cost, complexity, and infrastructure of conventional MRI systems (Tempel-Brami et al., 2015; Ramot et al. 2017b).
MALDI-IMS (Matrix-Assisted Laser Desorption Ionization – Imaging Mass Spectrometry)
Matrix assisted laser desorption ionization (MALDI) imaging was described for the first time by Caprioli and colleagues (Caprioli et al., 1997). This imaging technique utilizes a sample such as a frozen or formalin-fixed tissue section that is probed with a laser in two dimensions while recording a mass spectrum. Technically, a matrix is deposited on a thin tissue section. It absorbs at the laser wavelength of the MALDI ion source and ionizes the analytes. The slide with the section is moved in two dimensions in the mass spectrometer while a mass spectrum is recorded at each position (for each laser impact). The distance between each laser impact (spatial resolution) is selected by the individual before the acquisition. Molecular images are then constructed by correlating ion intensities with the exact position of the data from the sample. The molecular distribution of each detected ion in the tissue with the selected method can be generated. This permits simultaneous measurement of the spatial distribution of multiple analytes (DNA, peptides, proteins, sugars, small molecules, large organic molecules) without destroying the sample. Imaging software imports the mass spectrometer data and places them on an optical image of the sample. This allows identification and localization of chemical species and metabolites on the optical image. A classical staining (e.g. hematoxylin and eosin stain) can be applied on the tissue section at the end of the mass spectrometry imaging (MSI) acquisition or on an adjacent tissue section. The obtained picture is then overlaid with the generated molecular distributions in dedicated software.
Two main advantages of MSI are its specificity and the fact that the samples do not have to be labeled with probes or radionuclide. It is possible to detect a drug and its related metabolites on one tissue section and to generate the images of each molecule based on its m/z (mass to charge ratio) (Bonnel et al., 2011a). This detection method doesn’t require labeling of the targeted molecules (no radioactivity, no fluorescence, and no tracer). It can usually detect more than a thousand compounds from a tissue surface in a full scan mode of acquisition. The best spatial resolution that can be applied today is around 5 to 20 µm. It is thus possible to visualize the molecular distributions within histological structures.
Matrix assisted laser desorption ionization imaging can be applied on all tissues prepared for conventional microscopic investigation. Formalin-fixed and paraffin-embedded (FFPE) tissues are today the first choice for safety evaluation. Several examples of MSI applications on FFPE tissues have been published (Buck et al., 2016, Groseclose et al., 2008, Lemaire et al., 2007, Pietrowska et al., 2016, Stauber et al., 2008).
As for all analytical technologies, the MSI sensitivity must be determined for each targeted compound or class of molecules. Desorption and ionization processes depend on the chemical structure and on the physicochemical environment of the biological tissue. To maximize sensitivity with histological localization, quantitative mass spectrometry imaging (QMSI) has been developed to bring quantification aspects to the molecular distribution Hamm et al., 2012).
Applied during the first decades in proteomics on tissue in the life sciences (Bonnel et al., 2011b, Chaurand and Caprioli, 2002, Chaurand et al., 1999, Franck et al., 2009, Stoeckli et al., 2001), MALDI imaging has been quickly used in a wide range of applications in the pharmaceutical industry (Castellino et al., 2011, Hamm et al., 2012, Kreye et al., 2012, Prideaux et al., 2011, Prideaux et al., 2010, Prideaux and Stoeckli, 2012, Solon et al., 2010, Stoeckli et al., 2007 , Sun et al., 2016). Indeed, MSI experiments today allow combining the pharmacokinetics and pharmacodynamics information of the drug, making the connection between early stage drug metabolism pharmacokinetics and late stage development. This imaging technology can also be used in clinical investigations (e.g. punch biopsies in dermatology or biopsies in oncology).
Practical imaging applications
Practical ultrasound applications
Cardiac hypertrophy in genetically modified mice
Using an over-expressing ErbB2tg model (Sorensen et al., 2016, Sysa-Shah et al., 2012) and/or surgically induced hypertrophy (Takimoto et al., 2005), ultrasound identifies the extent of ventricular hypertrophy as well as allowing documentation of functional cardiac impairment. The ultrasound characteristics of the cardiac hypertrophy in the ErbB2 model are sufficiently specific to reduce the need for genotyping the mice, thus allowing conduct of subsequent studies knowing which mice are carrying the appropriate genotype (Figures 1 and 2). In support of this research, cardiac ultrasound can be used to define the functional aspects of cardiac hypertrophy in characterizing this disease model.
In clinical cardiology, echocardiography is a gold standard in the diagnostics of most cardiac diseases. In preclinical studies, echocardiography allows for characterization of anatomical changes without a need to sacrifice multiple groups of animals. Instead, the stages of the development of the pathological process can be tracked using echocardiography, at the same time obtaining information about functional changes, which in many cases, precede the anatomical changes. Echocardiography can be further complemented with electrocardiography, which provides additional information about developing cardiac hypertrophy (Sysa-Shah et al., 2012).
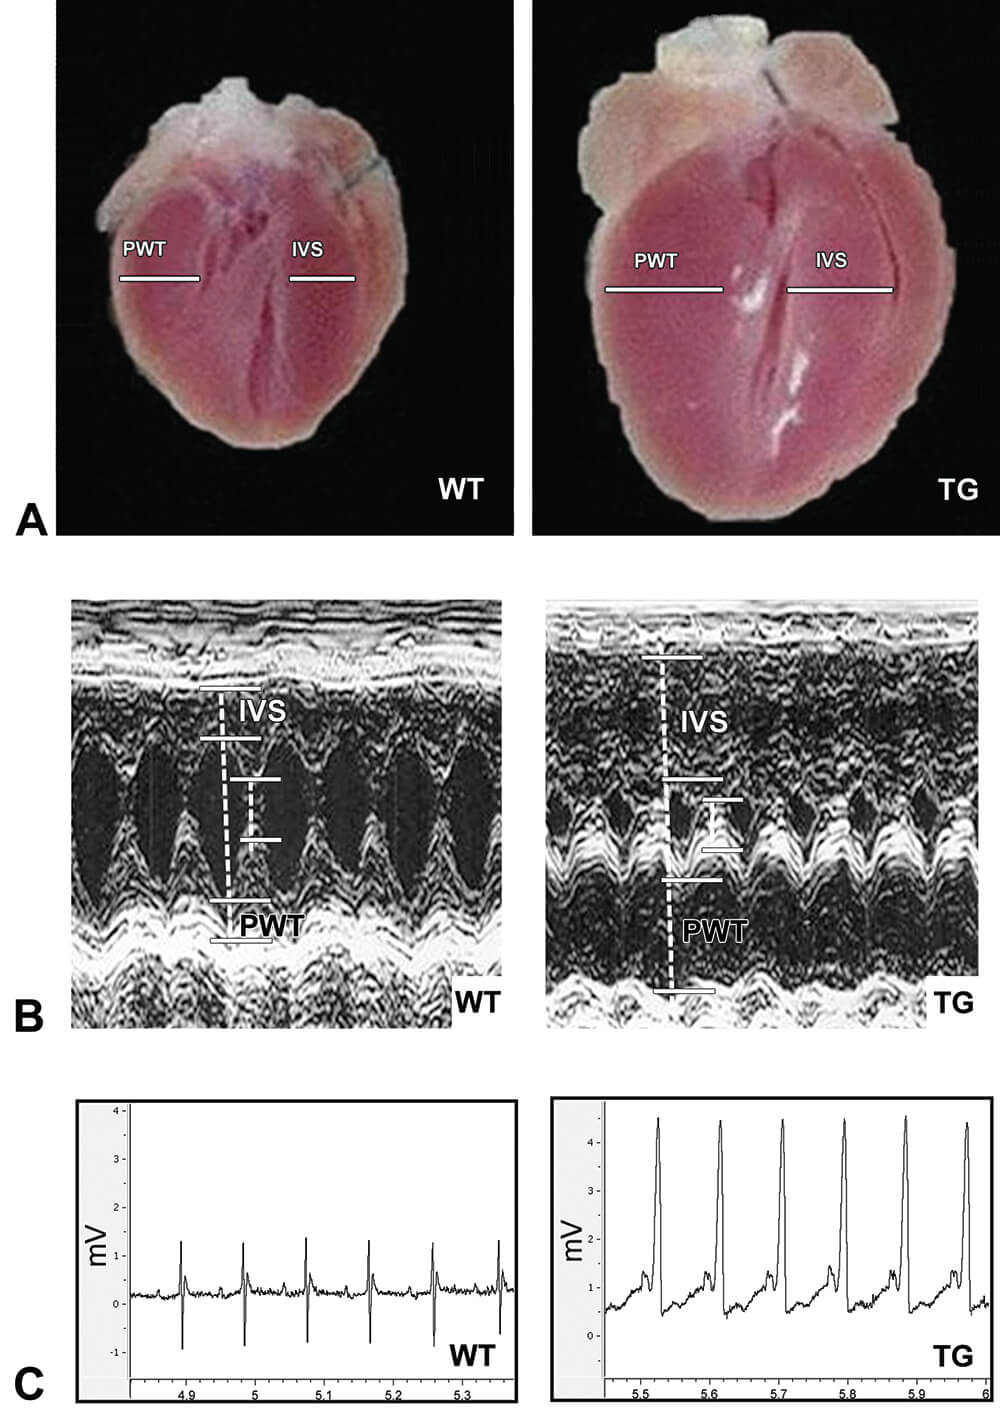
Figure 1. Comparison of gross morphology, echocardiography and electrocardiography in murine model of ErbB2 overexpression-induced cardiac hypertrophy. A. Cardiac ErbB2 overexpression in mice causes significant cardiac hypertrophy with thickening of left and right ventricular walls and interventricular septum and smaller left ventricle and right ventricle chambers. WT – Wild type, TG – Transgenic. B. Echocardiography supports gross morphological finding of cardiac hypertrophy with significant hypertrophy of the heart walls and reduction of left ventricle chamber in ErbB2tg mice. IVS – interventricular septum, PWT – left ventricle posterior wall. C. Electrocardiographic findings in ErbB2tg mice include increased amplitude of P and R waves, providing characteristic ECG signs of atrial and ventricular hypertrophy, accordingly. Other characteristic signs include ST segment depression and T wave inversion, and shortened PQ interval, also found in human patients with cardiac hypertrophy. (Reprinted with permission from Sysa-Shah et al., 2012).
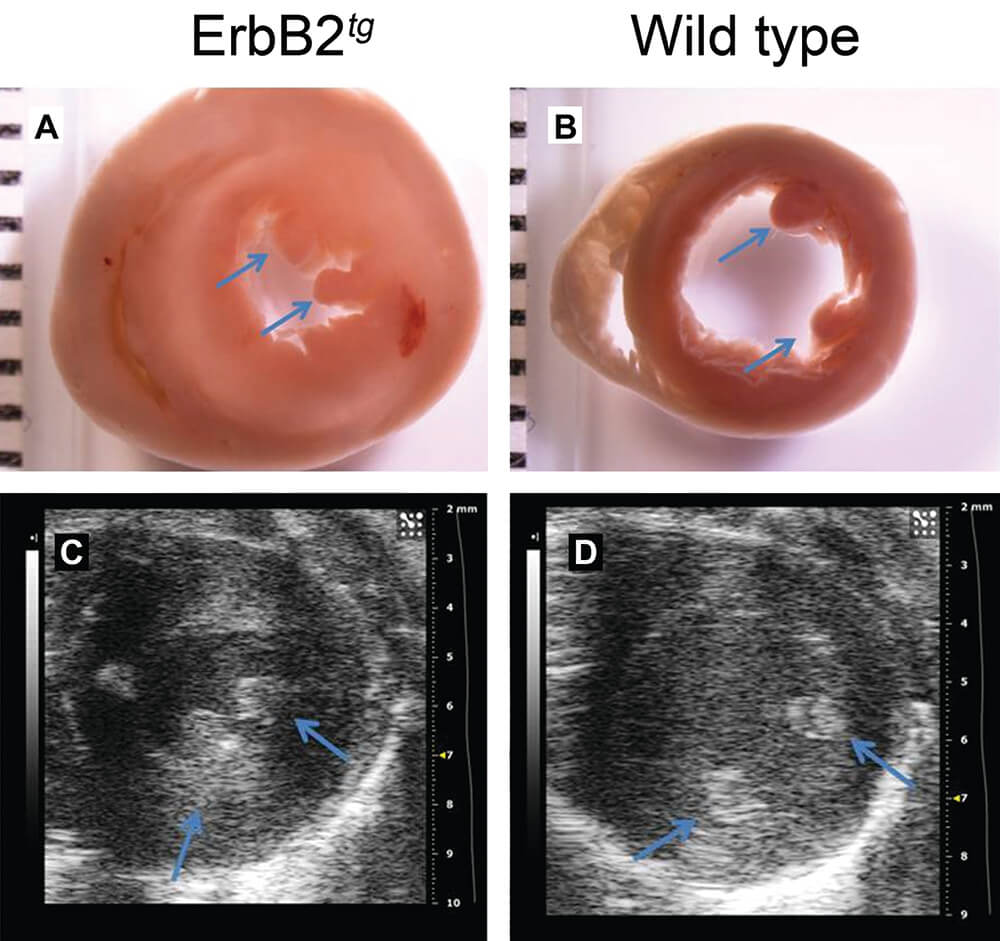
Figure 2. Cardiac hypertrophy in ErbB2tg mice. Gross pathology (transverse sections) displays significant cardiac hypertrophy and reduced left ventricular chamber in ErbB2 transgenic mice (A), compared to the wild type mice (B). C and D, B-mode (Bright mode) produced by echocardiographic imaging allows visualization of cardiac hypertrophy (thickened ventricular wall and septum, decreased measurements of left ventricular chamber) in living mice (ErbB2 transgenic mice (C) and wild type mice (D)). Blue arrows indicate anterior and posterior papillary muscles. (Reprinted with permission from Sørensen et al., 2016).
Load-induced cardiac hypertrophy and reversal in a murine model
Transverse aortic constriction (TAC) is a commonly used technique for experimental induction of pressure-overload cardiac hypertrophy and subsequent heart failure. Mice, which undergo TAC, gradually progress from compensatory cardiac hypertrophy to maladaptive cardiac hypertrophy resulting in heart failure.
Use of sildenafil in the TAC-induced cardiac hypertrophy mouse model was reported to prevent or delay the progression to maladaptive cardiac hypertrophy (Takimoto et al., 2005). Longitudinal echocardiography was used to track the changes caused by TAC to assist the scientists in selecting appropriate dosages of sildenafil, time points for euthanasia and to document the differences in heart anatomy and function in mice treated with sildenafil versus control mice (Figure 3). Usage of echocardiography not only permitted using smaller numbers of mice, but reduced costs and the amount of time to complete studies. Using echocardiography also ensured higher consistency of the data by comparing the changes in the same animal serially imaged before starting the experiment and imaged longitudinally throughout the experiment.
Using echocardiographic examination in both above hypertrophy models provides information including the degree of the functional and anatomical changes caused by the genetic or surgical intervention and resulting hypertrophy, as well as allows for longitudinal evaluations of the cardiac phenotype during development of the pathological condition. This functional information is not available from conventional histopathology collected from hearts at necropsy. Coupled together, in vivo imaging and conventional histopathologic studies allow the toxicological pathologist a more complete assessment of toxicological effects and disease progression. These studies also allow for interventional therapy during a toxicity trial or during a disease progression experiment.
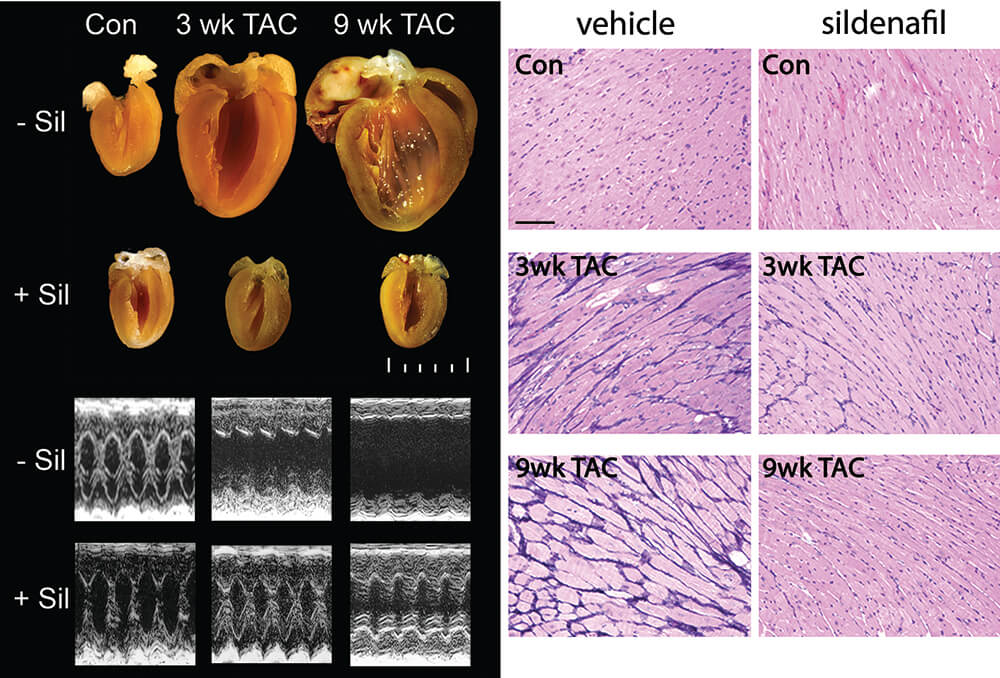
Figure 3. Sildenafil, a phosphodiesterase 5A inhibitor, prevents load-induced cardiac hypertrophy. Example of heart sections and M-mode echocardiogram. Scale, 1 mm. TAC-induced cardiomyocyte hypertrophy is prevented by sildenafil. PAS-methenamine–stained myocardium from vehicle- and sildenafil-treated mice. Dark blue color reflects fibrosis. Scale bar, 100 µm. Con – sham mice, 3 weeks after operation; TAC – transverse aortic constriction; Sil – sildenafil treatment; wk – week. (Reprinted with permission from Takimoto et al., 2005).
Imaging of aortic enlargement
One of the most dangerous manifestations of Marfan syndrome is aortic enlargement and rupture. Studies in the Marfan syndrome murine model show that affected mice develop aorta enlargement and weakening of aortic wall (Habashi et al., 2006, Ng et al., 2004). Serial ultrasound imaging was utilized to follow the progression of the development of aortal enlargement and thickening of aortal wall (Figure 4) and ultrasound was crucially important in the characterization of this mouse model and the identification of treatments to prevent aortic enlargement. These treatments are now in use in clinical trials in human Marfan syndrome patients.
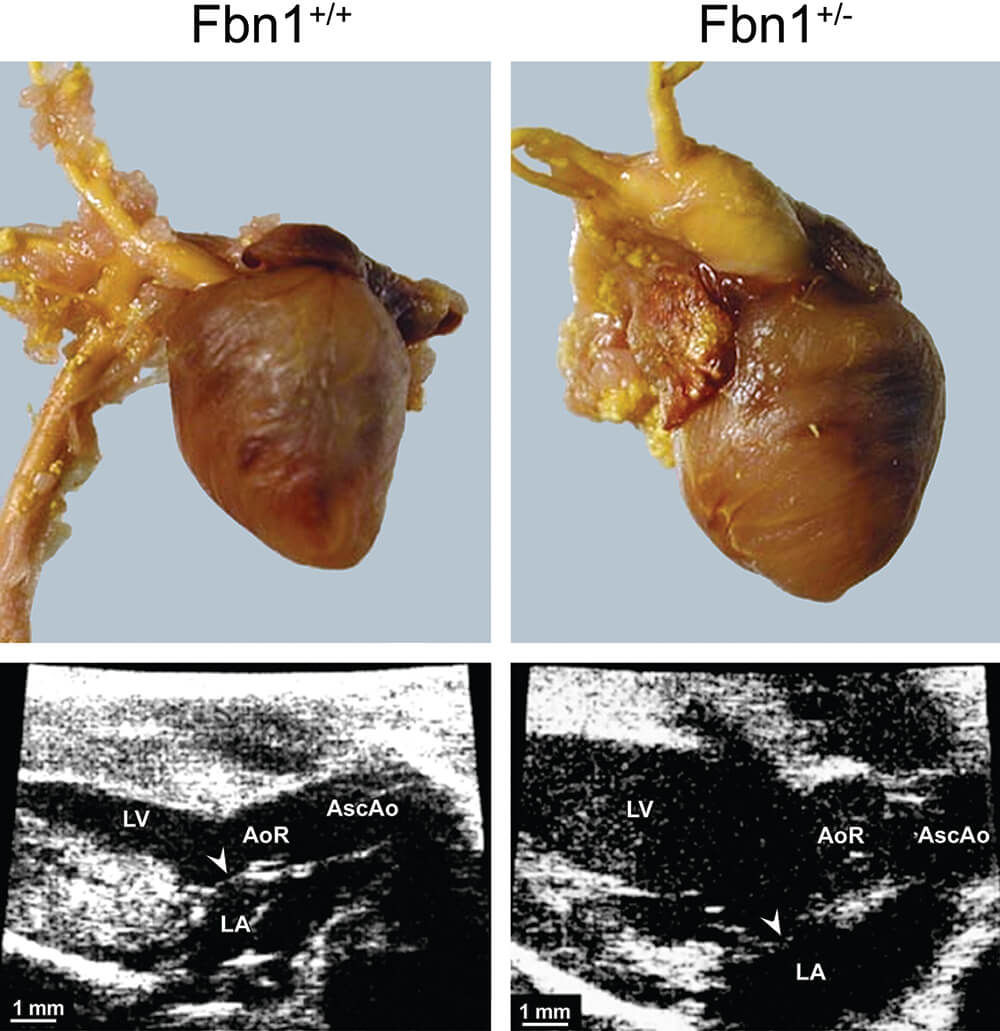
Figure 4. Comparison of gross morphology (upper panels) to two-dimensional (2D) ultrasound imaging (lower panels) in a murine model of Marfan syndrome (fibrillin-1 (Fbn1)-deficient mice). Gross pathology of hearts from wild-type mice (left) compared to fibrillin-1 (Fbn1) C1039G/+ animals (right). LV – left ventricle, LA – left atrium, AoR – aorta, AscAo – ascending aorta. (Reprinted with permission from Ng et al. 2004).
Examples of PET/SPECT
Cardiac cell death in the rat model of doxorubicin-induced cardiotoxicity
Doxorubicin has been known for decades to induce short- and long-term cardiac toxicity side effects. Multiple studies have been performed to investigate novel preventive, diagnostic and treatment options to protect the cancer patients from doxorubicin and other anthracyclines side effects during cancer therapy. One of the challenges of preclinical studies directed against doxorubicin-induced cardiotoxicity is finding a method to evaluate the damage caused by experimental doxorubicin treatment as well as observe and quantify the effects of experimental cardioprotective drugs.
One of the methods proposed and tested by several groups was visualization of Tc99m -labeled Annexin V in the heart by SPECT (Bennink et al., 2004, Gabrielson et al., 2008). Annexin binds to phosphatidylserine, which is a cell membrane component that is normally hidden in the cellular membrane, but becomes exposed to the outside of dying cells. SPECT imaging displayed increased uptake of radiolabeled Annexin V in the hearts of rats treated with doxorubicin versus saline control (Figure 5). Increased cardiac cell death, induced by doxorubicin versus saline control, was further confirmed with terminal deoxynucleotidyl transferase dUTP nick-end labeling (TUNEL)-staining of cardiac tissue after the rats were sacrificed.
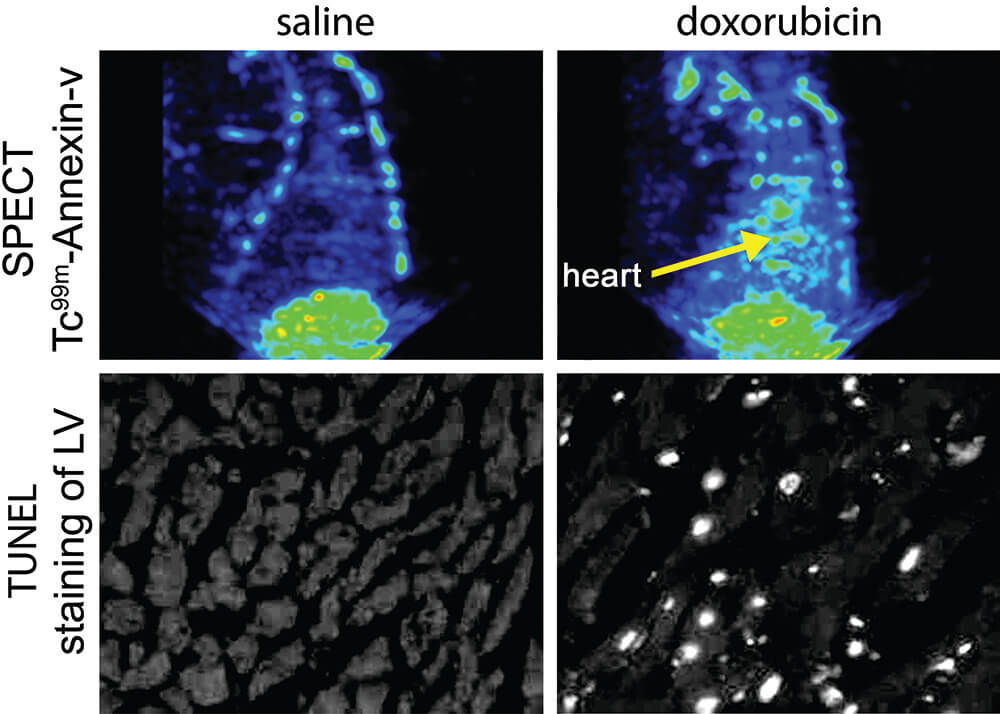
Figure 5. SPECT imaging of cell death in the rat heart. Rats were treated with doxorubicin at 2.5 mg/kg once a week for 6 weeks. Rats then were injected with 99m Tc-HYNIC-Annexin V. TOP ROW: Relative to a SPECT image of the thorax of a saline control rat, SPECT images from a doxorubicin-treated rat show increased uptake of radiolabeled annexin (arrow) in the heart. BOTTOM ROW: The extent of cardiac cell death in TUNEL-labeled tissue sections converted to black/white from saline control and doxorubicin-treated rats. White nuclei indicate TUNEL-stained apoptotic nuclei. TUNEL staining correlated well with the information supplied by SPECT, indicating that SPECT imaging is a useful non-invasive means of identifying cell death in vivo. LV – left ventricle. (Reprinted with permission from Gabrielson et al., 2008).
Detection of distant metastases in a mouse model of cancer
SPECT and PET are also useful in finding distant cancer metastases. In many cases, the number and localization of cancer metastases have more impact on prognosis and consequent treatment strategy than the primary tumor. Proper evaluation of distant metastases is essential in cancer stage determination and in subsequent decisions about treatment options. The search is ongoing for the most sensitive imaging technique that is especially selective for malignant cells. A new approach has been to use cancer specific imaging reporter genes, such as AEG-1 (astrocyte-elevated gene-1), as has been recently used detecting prostate cancer distant metastases (Bhatnagar et al., 2014). This reporter gene is activated in cancer cells that have elevated levels of certain transcription factors which bind to the promoter of AEG-1 and activate it, leading to transcription of thymidine kinase (TK) for SPECT application (Figure 6) or luciferase, a reporter used in optical imaging. In these experiments, mice are injected with the DNA construct that has AEG-1 promoter driving the reporter gene. This DNA is hypothetically taken up by all cells in the mouse but has been shown to only become activated producing the reporter gene in cancer cells that have elevated transcription factors such as c-myc. AEG-1 promoter has multiple c-myc binding sites. Another imaging vector with a different promoter, PEG-3, has been used to drive imaging reporter genes in preclinical imaging of distant metastases of melanoma (Bhang et al., 2011).
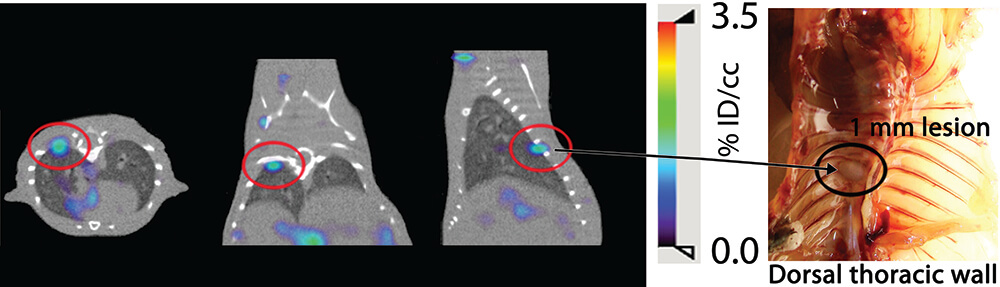
Figure 6. AEG-Promoter-based SPECT/CT imaging detects distant metastasis. Approximately 5 weeks after receiving an intracardiac administration of PC3-ML-Luc cells, the prostate cancer cohort and the control mice received pAEG-HSV1tk–PEI polyplex. Forty-eight hours after plasmid delivery, mice received the known HSV1-TK substrate, 2′-fluoro-2′-deoxy-β-d-5-[125I]iodouracil-arabinofuranoside ([125I]FIAU), and were imaged at 18 to 20 hours after injection of the radiotracer. Thymidine kinase phosphorylates [125I] FIAU and locks the tracer in the cell allowing imaging identification. A metastatic nodule was detected by SPECT imaging: 3 projections on the left. A 1mm metastatic nodule was found during necropsy on the right.
Kidney injury model
Glomerular filtration rate (GFR) is the gold standard in kidney function assessment (the efficiency to clear small molecular waste products from the blood stream), and is used to determine the status of kidney disease and drug-induced kidney toxicity. Most preclinical rodent models depend on markers of renal physiological function such as measuring blood levels of creatinine and urea. Recent reports suggest new, minimally invasive techniques correlate with histological glomerular damage in mice. One approach utilizes a transcutaneous device that measures the half-life of intravenously administered FITC-sinistrin (Ellery et al., 2015, Scarfe et al., 2015, Taruttis et al., 2012), a molecule cleared by glomerular filtration. Another approach uses multispectral optoacoustic tomography (MSOT), with a photoacoustic imaging device that directly visualizes the clearance of the near infrared dye, IRDye 800CW carboxylate (Ellery et al., 2015). The results obtained with these techniques were compared with 24-hour-albuminuria or urinary albumin/creatinine ratio, serum creatinine, blood urea nitrogen, and histologic staining with Picro-Sirius red and Masson’s Trichrome (Scarfe et al., 2015). Both methods allow longitudinal evaluation of kidney function and can be employed for the repeated and minimally invasive measurement of kidney function. Similarly, inulin is neither secreted or absorbed by renal tubules and its clearance from the blood is directly proportional to GFR and can be tracked using cardiac imaging (Figure 7).
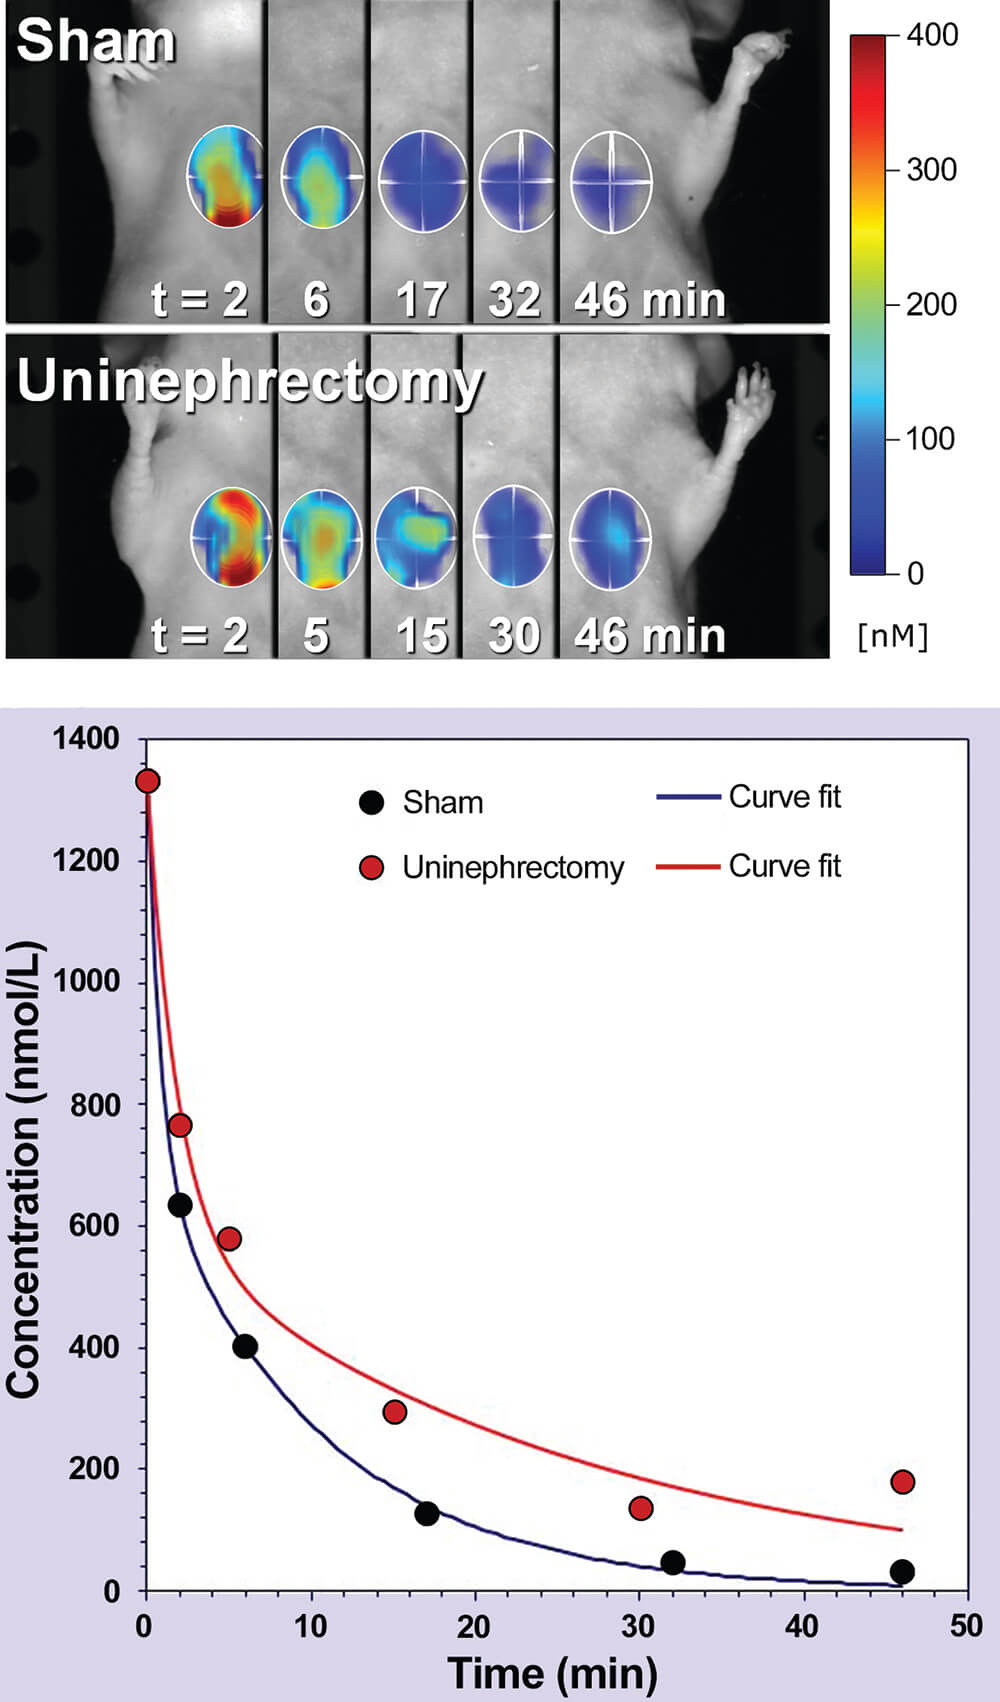
Figure 7. Kinetic heart imaging by fluorescence molecular tomography (FMT). TOP: Two representative mice (sham and uninephrectomized) are shown at the indicated imaging times. Since inulin clearance from the circulation is directly proportional to glomerular filtration rate as a measure of kidney function, the heart was imaged to show inulin clearance. Heart signal in 3D is shown for each time point, with higher concentration signals represented by shades of red. BOTTOM: Kinetic blood clearance curves. Data sets from representative sham and uninephrectomized mice are shown. (Reprinted with permission of Peterson 2013).
Liver injury model
Drug-induced hepatotoxicity reduces the rate of approval of new chemical entities and plays a major role in the withdrawal of approved drugs from the market (Dimasi, 2001). The use of optical imaging that permits identification of liver changes has been shown by quantitative fluorescence molecular tomography (FMT) imaging of far-red (FR) (Vasquez et al., 2011) or near infrared (NIR) (Filonov et al., 2011, Vasquez et al., 2011) imaging agents to non-invasively visualize and quantify the bio-distribution of different agents over time, providing real-time imaging of oxidative and nitrosative stress in the liver of live animals during drug-toxicity testing (Shuhendler et al., 2014).
The induction of acute hepatic damage by acetaminophen, N-acetyl-p–aminophenol, (APAP), is one of the most commonly used experimental models of acute liver injury in mice. The specific value of this model is its high reproducibility, dose-dependency and known pathogenic mechanism (Hinson et al., 2010; Mossanen and Tacke, 2015; Ramachandran and Kakar, 2009). APAP induced liver injury has been quantified non-invasively in vivo with Annexin-Vivo 750 in conjunction with PerkinElmer’s imaging platform. This approach provides a robust and quantitative method for assessing hepatocellular toxicity in the liver of living mice, and the results correlated well with direct imaging of excised liver fluorescence (Figure 8). The time course and dose-response of APAP-induced liver injury were quantified by imaging, and the results correlated well with serum ALT activity, direct imaging of excised livers, qualitative assessment of liver damage by H&E staining, and an increase in TUNEL-staining. Tomographic imaging provided additional depth detection and detail of signal within the liver, as well as detection of the expected kidney clearance of Annexin V (Vasquez and Peterson, 2014).
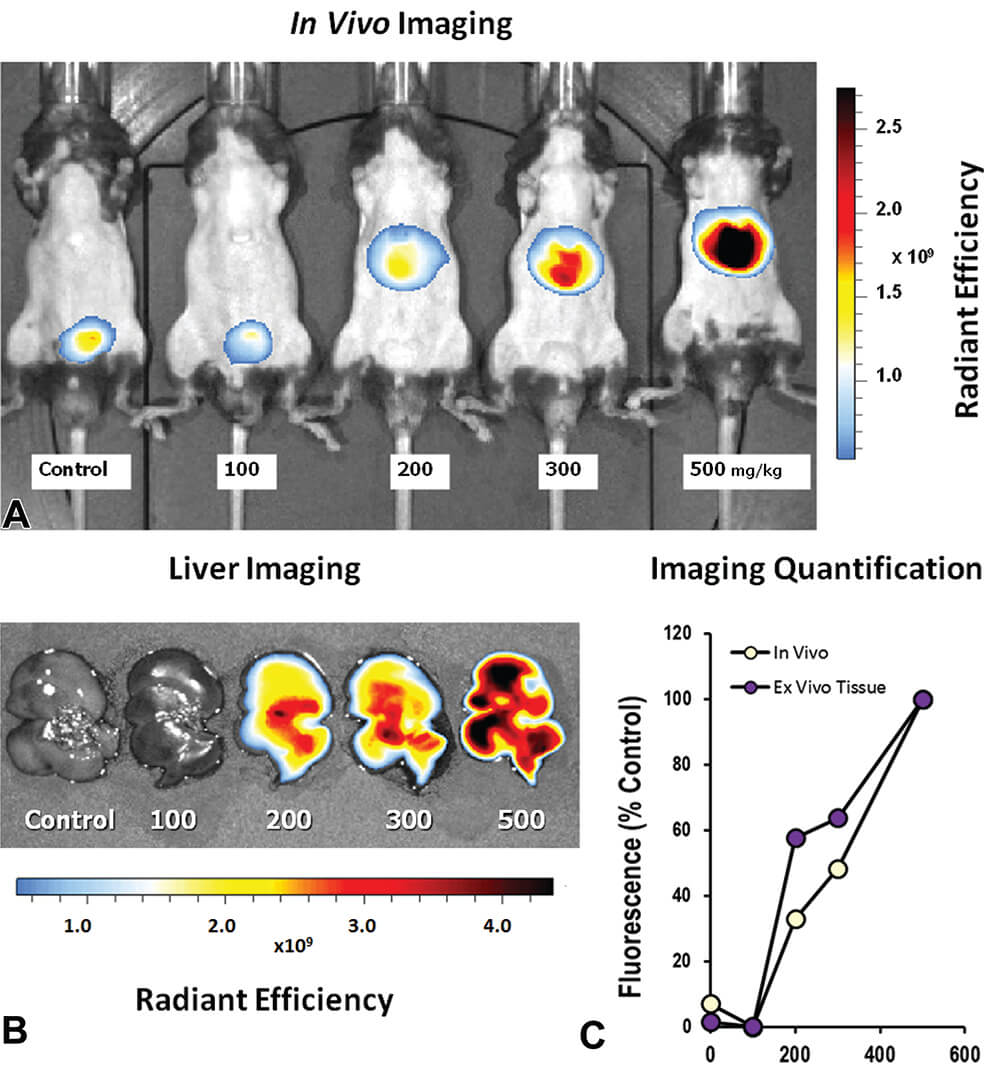
Figure 8. Whole mouse epifluorescence imaging was used to detect accumulation of Annexin-Vivo 750 following acetaminophen (APAP) exposure. A. Epifluorescence images of mice receiving different doses of APAP 24 h prior to imaging shows an increase in signal with APAP dose. B. Epifluorescence imaging of excised livers from APAP treated mice. C. Quantification of liver signal from non-invasive imaging and ex vivo imaging was determined by ROI placement to capture the entire liver, and results were represented as the percent of the 500 mg/kg group. (Reproduced with permission from Vasquez and Peterson 2014).
Skin Sensitization Studies
Skin sensitization is assessed by different tests: the Draize test, open epicutaneous test, optimization test, split adjuvant test, guinea pig maximization test, Buehler test, and murine local lymph node assay (LLNA). In the LLNA test, the test substance is applied on the surface of the ears of a mouse for three consecutive days, and the proliferation of lymphocytes in the draining lymph node is measured at the end of the study (Parasuraman, 2011). Recently, we reported about the development of the Laser Speckle Imaging (LSI) system for visualization and quantitative assessment of an acute vascular reaction to topical application (without prior sensitization) of a known mild irritant. Assessing the immediate response to topical application of potential irritants is particularly challenging by currently available diagnostic practices. The developed LSI is part of the dual-mode imaging system schematically presented and shown in Figures 9 and 10. The dual-mode imaging system utilizes the LSI and Fluorescent Intravital Microscopy (FIM) modes for simultaneous imaging of the same area of external mouse ear skin surface in vivo (Kalchenko et al., 2014b). With further development, these methods will become a real quantitative tool for noninvasive assessment of allergic reactions and could substitute for the classic mouse ear swelling test and concomitantly reduce animal suffering. Potential translation of the technique to clinical practice for effective testing of allergens in human skin and for testing new synthetic materials is anticipated.
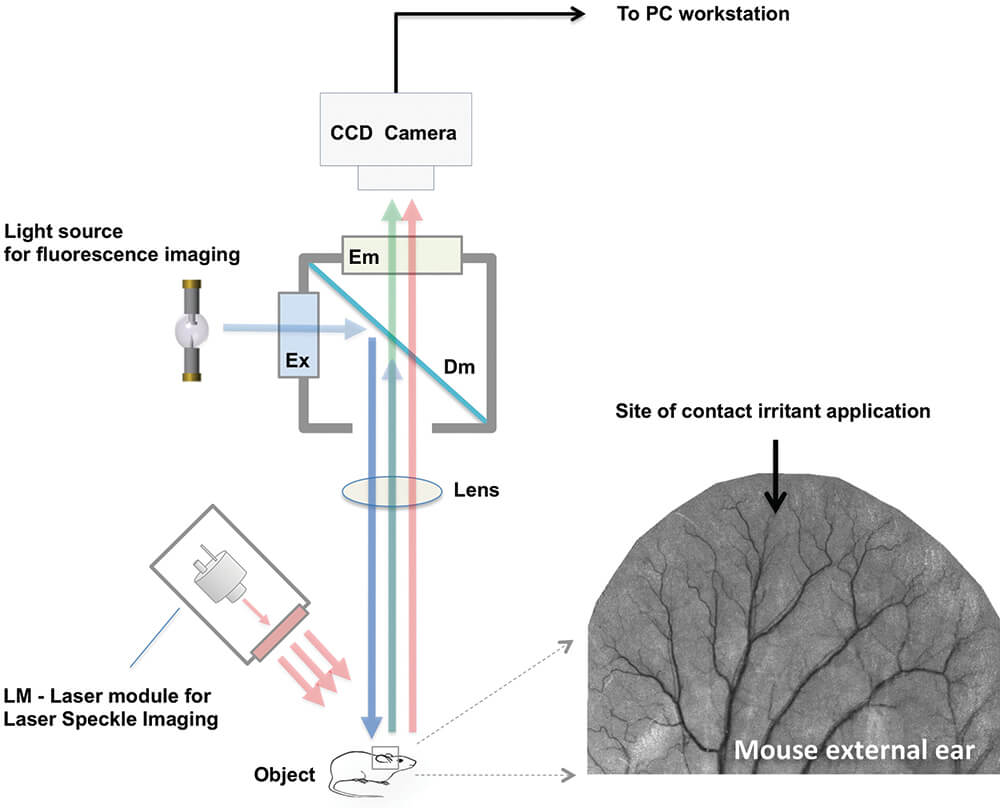
Figure 9. Schematic presentation of the dual-mode imaging system. The image of external mouse ear obtained by using laser speckle imaging (LSI) mode with long (650 ms) exposure time. Site of topical application of contact irritant is marked by a black arrow. In the LSI mode, the laser module with optical diffuser (LM) and digital CCD camera are used as light source and detector, respectively. The CCD camera is mounted by C-mount adaptor on top of the standard fluorescent microscope used in the fluorescent intravital microscopy (FIM) mode. A mercury discharge lamp is utilized as a light source for fluorescence imaging. Light from the light source passes through the excitation optical filter (Ex) and is projected by dichroic mirror (Dm) onto the same area of mouse ear as visualized by LSI. The fluorescence signal filtered by the emission band-pass filter (Em) is detected by the CCD camera that is connected to a PC-based workstation used for LSI and FIM image processing. (Reprinted with permission from Kalchenko et al., 2014a).
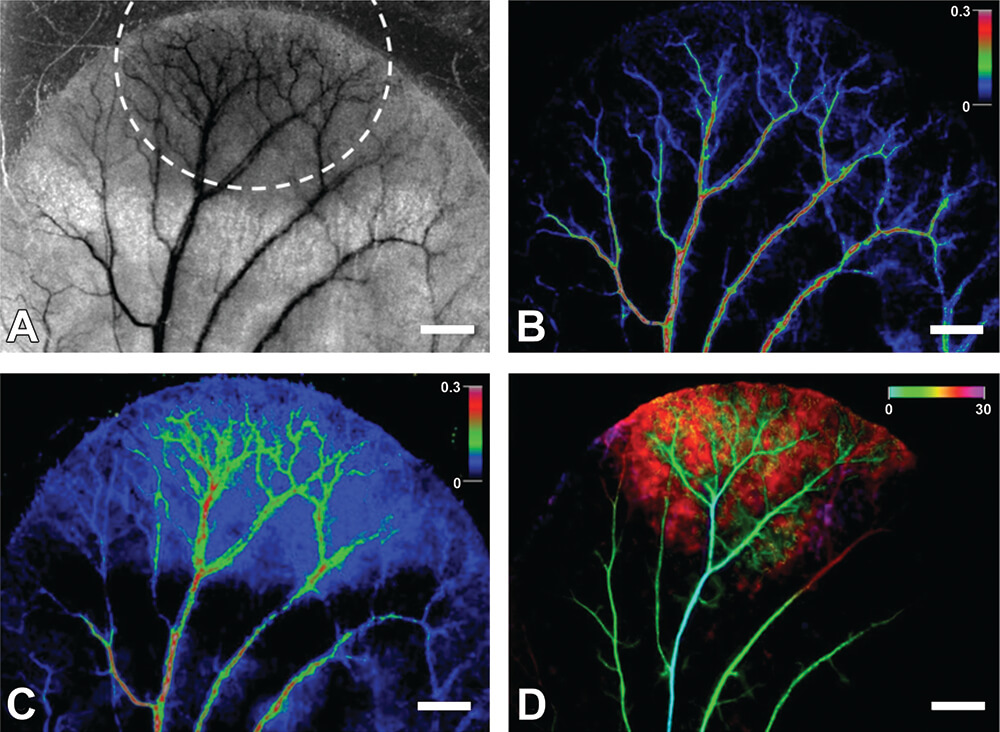
Figure 10. The images of the external mouse ear in vivo. A. The monochrome image of the area of methyl salicylate (MS) agent topical application (highlighted by the dashed line), was obtained by LSI mode with the long (650 ms) exposure time. B and C show, respectively, the color-coded images before and after 30 min of MS agent application. The color bar shows speckle contrast in arbitrary units. D. The temporal color-coded image of the same area of mouse ear observed in the FIM mode after injection of FITC-Dextran. The image shows temporal color-coded FITC contrast filling of the mouse ear vasculature and tissue during 30 s as shown in the color bar. White bar is 1 mm.
Brain toxicity studies
In vivo imaging of the brain in general and brain blood vessels specifically, is essential for assessment of brain function under varying conditions in both clinical and experimental settings. There are a variety of optical imaging modalities used for this purpose including optical coherence tomography, photo-acoustic microscopy, and photo-acoustic tomography. However, imaging of cerebral blood vessels through the intact skull remains challenging. Limitations such as the necessity to remove part of the skull or expensive equipment restrict the use of this procedure in settings such as preclinical trials. Blood-brain barrier (BBB) breakdown allows penetration of blood-borne toxic substances into brain resulting in neuronal degeneration and enhanced inflammatory destruction (Banerjee and Bhat, 2007). The ability to optically monitor the BBB disruption in real-time could provide real-time monitoring of hypertonic disruption and/or facilitate dosage control for chemotherapeutic drugs that require hypertonic disruption (Joshi et al., 2011). To monitor the BBB disruption Dynamic Light Scattering (DLSI) modality was used to mark blood vessels (green) and detect fluorescein leakage through BBB in the right hemisphere following internal carotid artery catheterization and simultaneous injection of mannitol and fluorescein (Figure 11).
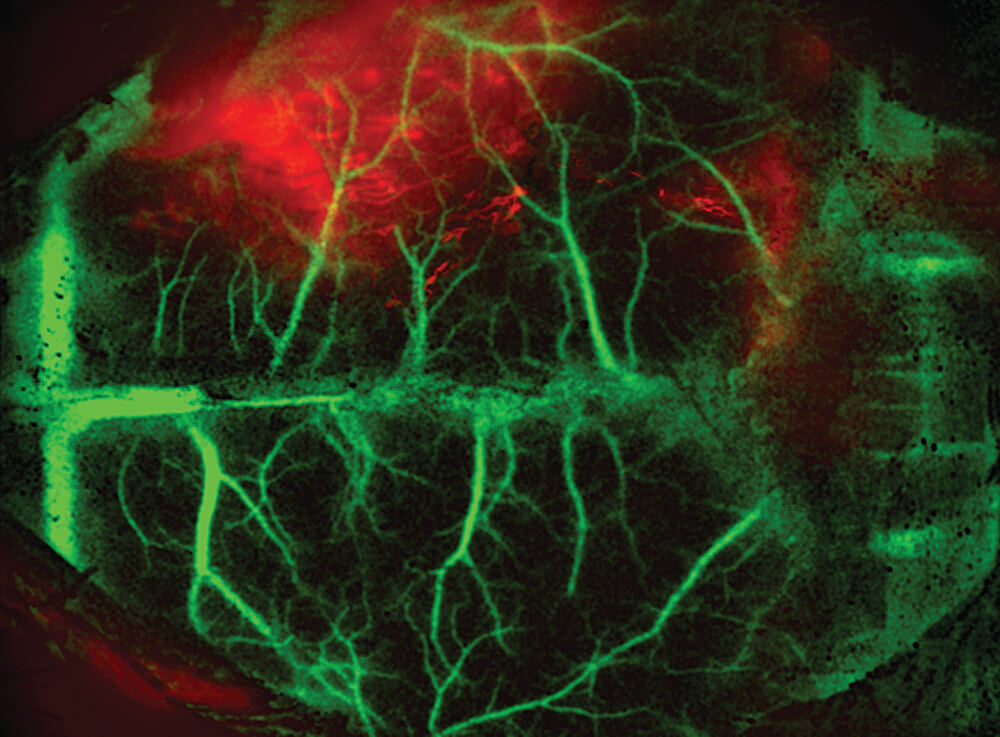
Figure 11. DLSI of anesthetized mouse injected with mannitol 5µl (20%) simultaneously with fluorescein. Fluorescent image was acquired 5 minutes after mannitol and fluorescein administration.
Recently, we have presented a novel, minimally invasive method for vascular imaging through the sufficiently transparent intact skull of young mice. Our method combines laser speckle (LSI) and fluorescent imaging with dynamic color mapping and image fusion (Figure 12). Quickly generated wide-field images present clear visual information on blood flow and perfusion in the cerebral cortex and meninges. The ability of the method to visualize hemodynamic changes was demonstrated by induced occlusion of the middle cerebral artery (Figure 13). The compact and easily operated system is comprised of several pieces of standard and affordable laboratory equipment. This simple, robust and inexpensive method may become an important tool for assessment of brain hemodynamics in preclinical studies (Kalchenko et al., 2014a).
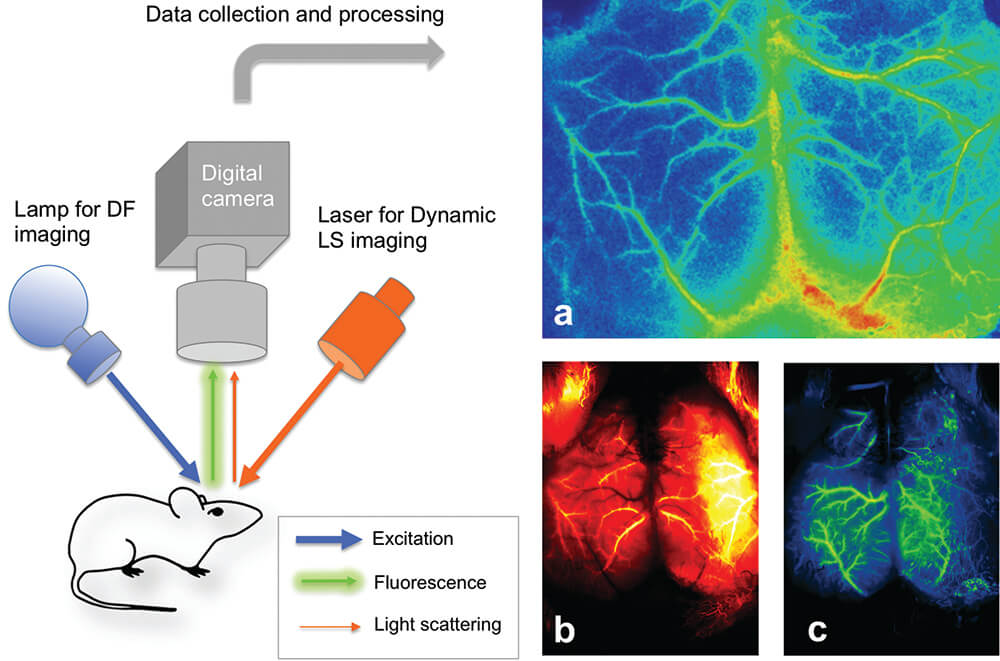
Figure 12. Schematic presentation of the transcranial optical vascular imagining (TOVI) imaging setup method (left panel), which similarly combines laser speckle imaging (LSI) and dynamic fluorescence (DF) modes. a. Processed, color enhanced LSI image of perfused mouse cerebral blood vessels. b. Color enhanced fluorescence image obtained 3 second after bolus injection of 50 microliters of fluorescein (arterial phase). c. Color-enhanced fluorescence image of the same mouse obtained 1 second later (early venous phase).
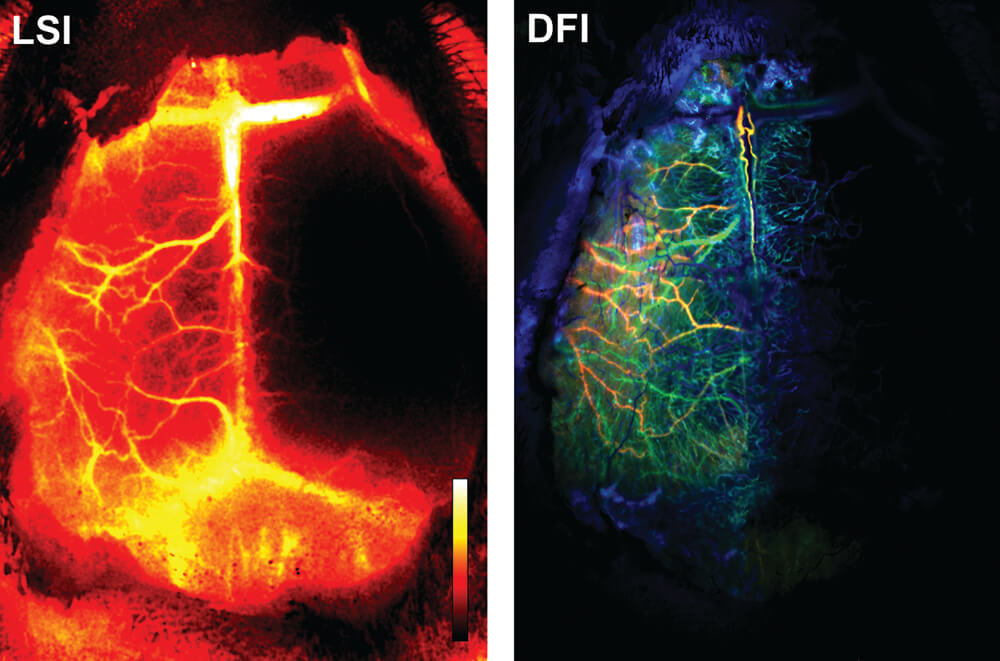
Figure 13. An example of pathological observation assisted by the transcranial optical vascular imaging (TOVIethod similarly combines LSI and DF modes. LSI – Processed LSI color-coded image showing a mouse with lack/low perfusion in the right hemisphere. Color bar represents level of blood perfusion with black indicating the lowest level of perfusion. DFI – Rendered DFI Color coded image obtained from the same mouse. Red, green and blue colors correspond with arterial, early venous and later venous phases of blood perfusion, respectively.
Examples of application of the compact MRI
Neurotoxicity
The classical neurotoxin 3-nitropropionic acid (3NP) was administered to rats as a model for Huntington’s disease. The compound was administered at 55 mg/kg/day for 8 days to 3 Lewis rats via osmotic mini-pump (i.p.) to induce lesions in the nucleus caudatus and putamen of the brain corresponding to the striatum in humans, the structure where the Huntington’s disease-associated lesions are prominent. Three rats served as untreated controls. Formalin perfusion was used at necropsy. Sixty-four transverse digital sections of each brain were acquired by a compact MRI system (Tempel-Brami et al., 2015). Subsequently, transverse sections stained with hematoxylin-eosin and cresyl violet-luxol fast blue were prepared for histopathologic examination. The ex-vivo MRI targeted the location and the size of neuropathological lesions with good precision. Histopathologically, the lesions were described as neurodegeneration, characterized by hemorrhage and spongiosis in the nucleus caudatus and putamen. The ex- vivo MRI was successful in localizing the 3NP-induced neurotoxic lesions, allowing the quantification of the damage and correlation with histopathology (Figure 14).
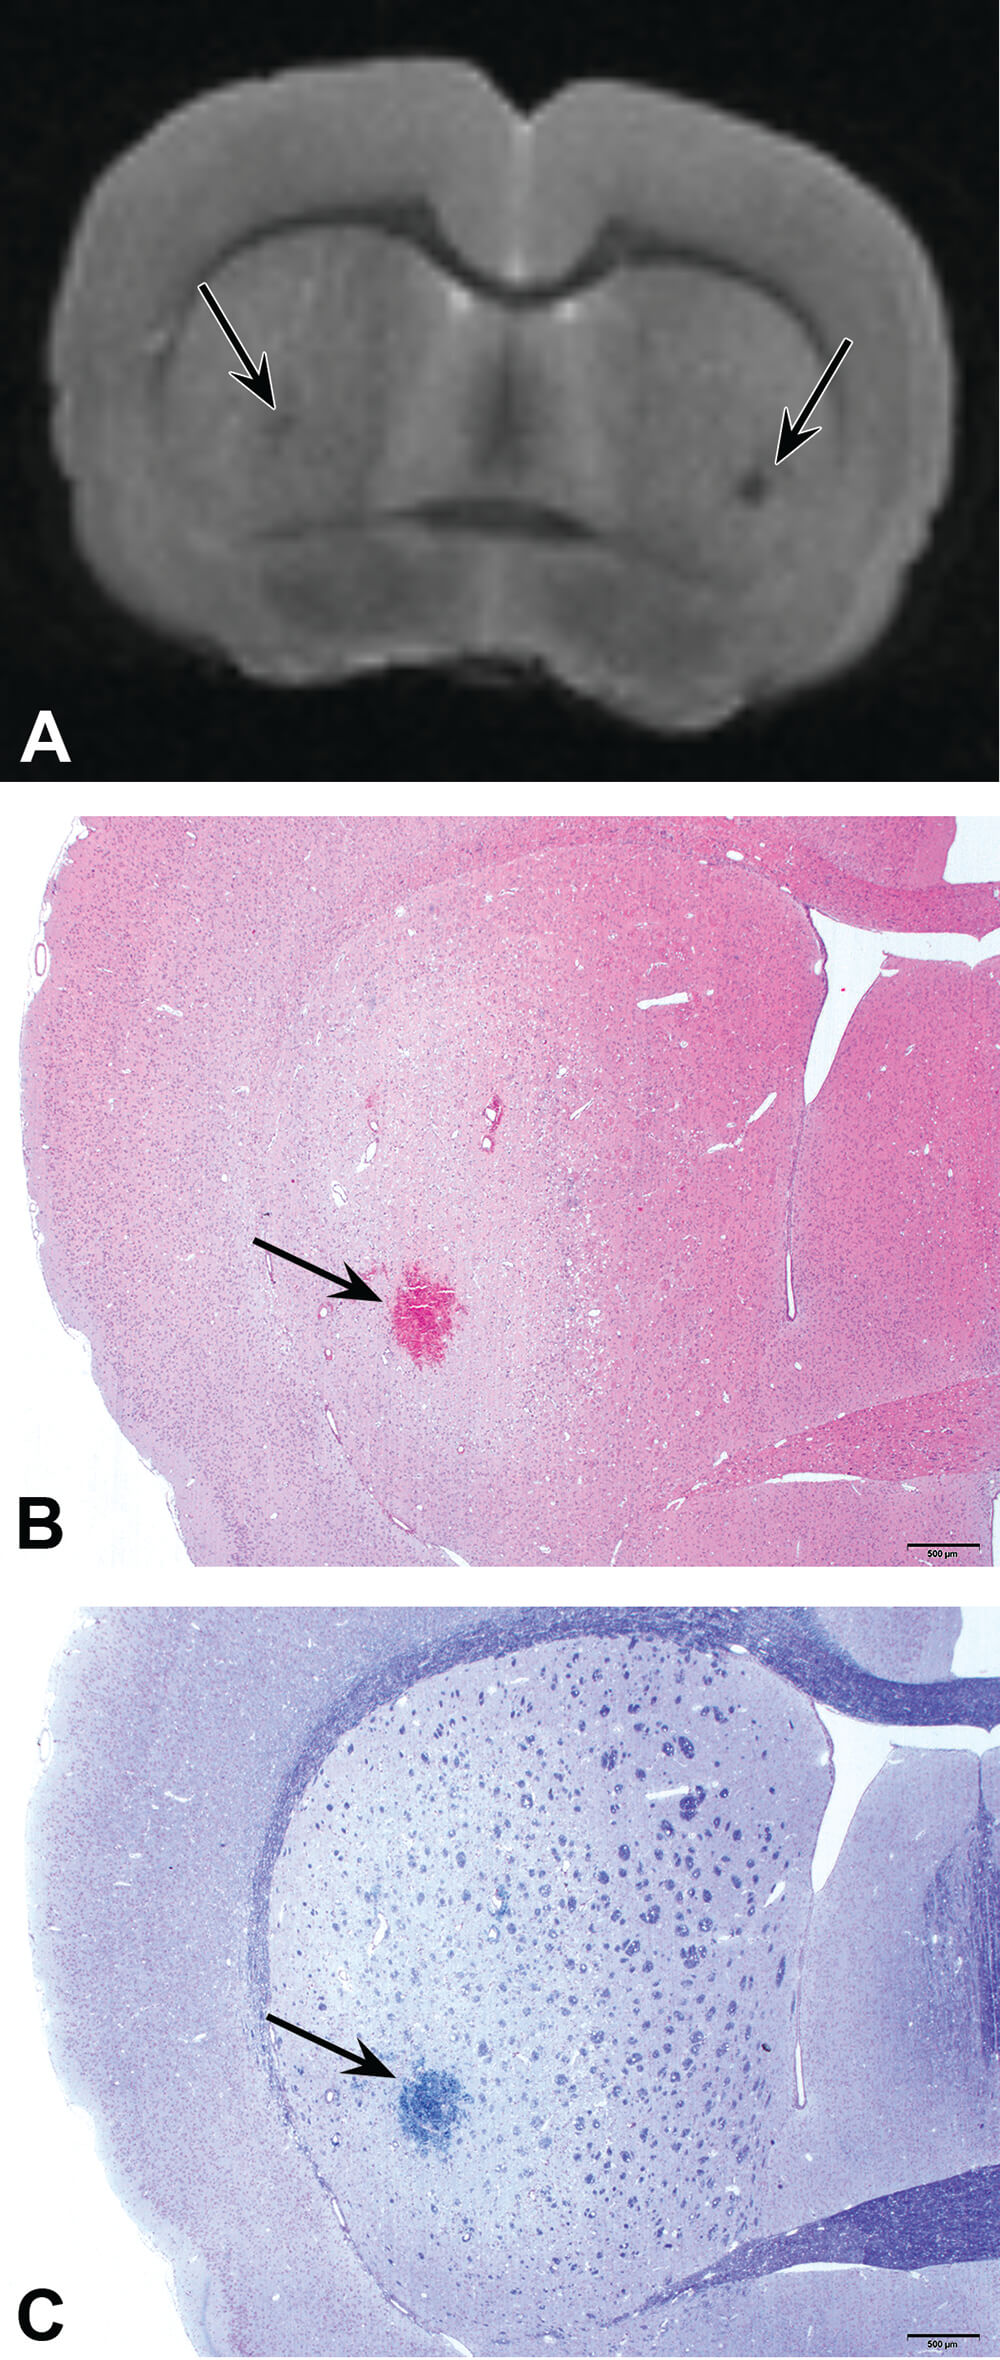
Figure 14. Localization (arrow) of brain lesions in the caudate putamen of rats exposed to 3-nitropropionic acid. A. MRI photo showing bilateral focal areas of low signal intensity (arrows). B. H&E staining showing area of the lesion consisting of hemorrhage and vacuolation. C. Luxol fast blue/cresyl violet staining/ showing the same affected area as in A and B.
In a second neurotoxic model, intraperitoneal (i.p.) administration of lithium chloride (127 mg/kg), was followed by i.p. administration of pilocarpine (30 mg/kg), to produce a status epilepticus model in the rat (Taketa et al., 2015). One week after dosing, the perfused, fixed brains were collected, imaged using the compact MRI, and examined histopathologically. In the MRI-captured brain images from treated rats, areas of high T1 and middle to low T2 signals, when compared to controls, were noted in the piriform cortex, lateral thalamic nucleus, posterior paraventricular thalamic nucleus, and posterior hypothalamic nucleus in the cerebrum. Histopathology confirmed that the altered MRI signals were consistent with well-circumscribed foci of neuronal cell degeneration/necrosis accompanied by gliosis (Figure 15). The conclusion of this experiment was that the quick analysis of fixed organs by an MRI system can provide useful information for selection of sampling sites for histopathological slide preparation, especially in complex and functionally heterogeneous organs such as the brain.
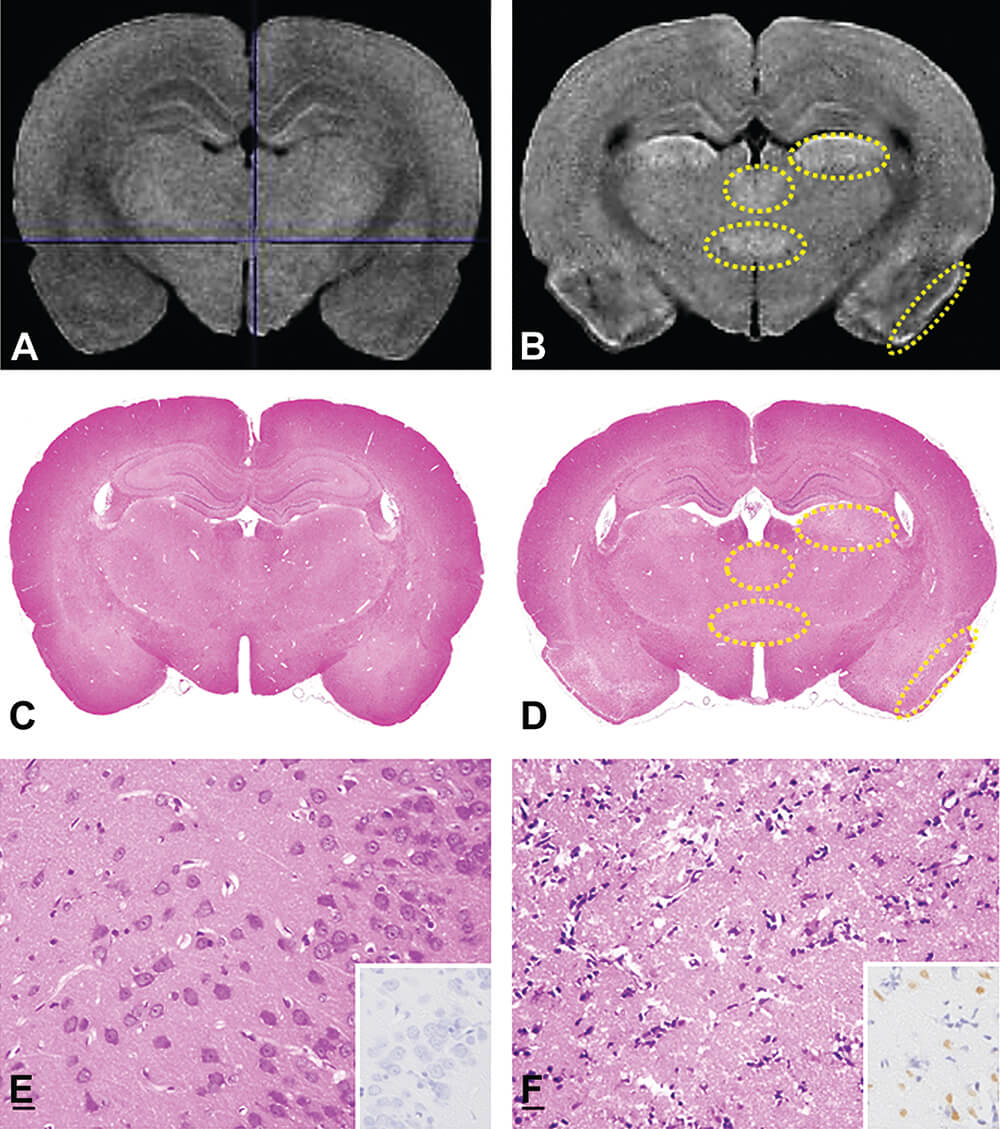
Figure 15. MRI images (A and B), T1- weighted images and comparative histology with H&E staining (C to F). The T1-weighted image of the lithium chloride/pilocarpine-treated brain (B) showed high T1 signal areas (yellow dotted line regions) compared to the control animal (A). In histology of the comparative cross section, the lithium chloride/pilocarpine- treated brain (D and F) exhibited pale areas in the piriform cortex and lateral thalamic nucleus compared to the control (C and E). Photos E and F are higher magnification of the piriform cortex. E is normal control. In F, there is widespread necrosis with neuronal loss. INSET: E. TUNEL negative staining. INSET: F. TUNEL positive staining. (Reprinted with permission of Taketa et al. 2015).
Anti-cancer drug testing
We used the Mdr-/- mouse model, that is known to develop age-associated spontaneous liver lesions to detect, count, and measure the volumes of the lesions (Tempel-Brami et al., 2015). In vivo MRI detected focal liver lesions in all mice. Ex vivo MRI allowed for digital segmentation and quantification of all individual lesions. It was feasible to detect small foci with volumes of 0.3 mm3 (Figure 16). In addition, the total lesion volume in the entire liver was calculated. The lesions were diagnosed by conventional histopathology as focal fatty lesions in some of the mice and hepatocellular carcinomas in others.
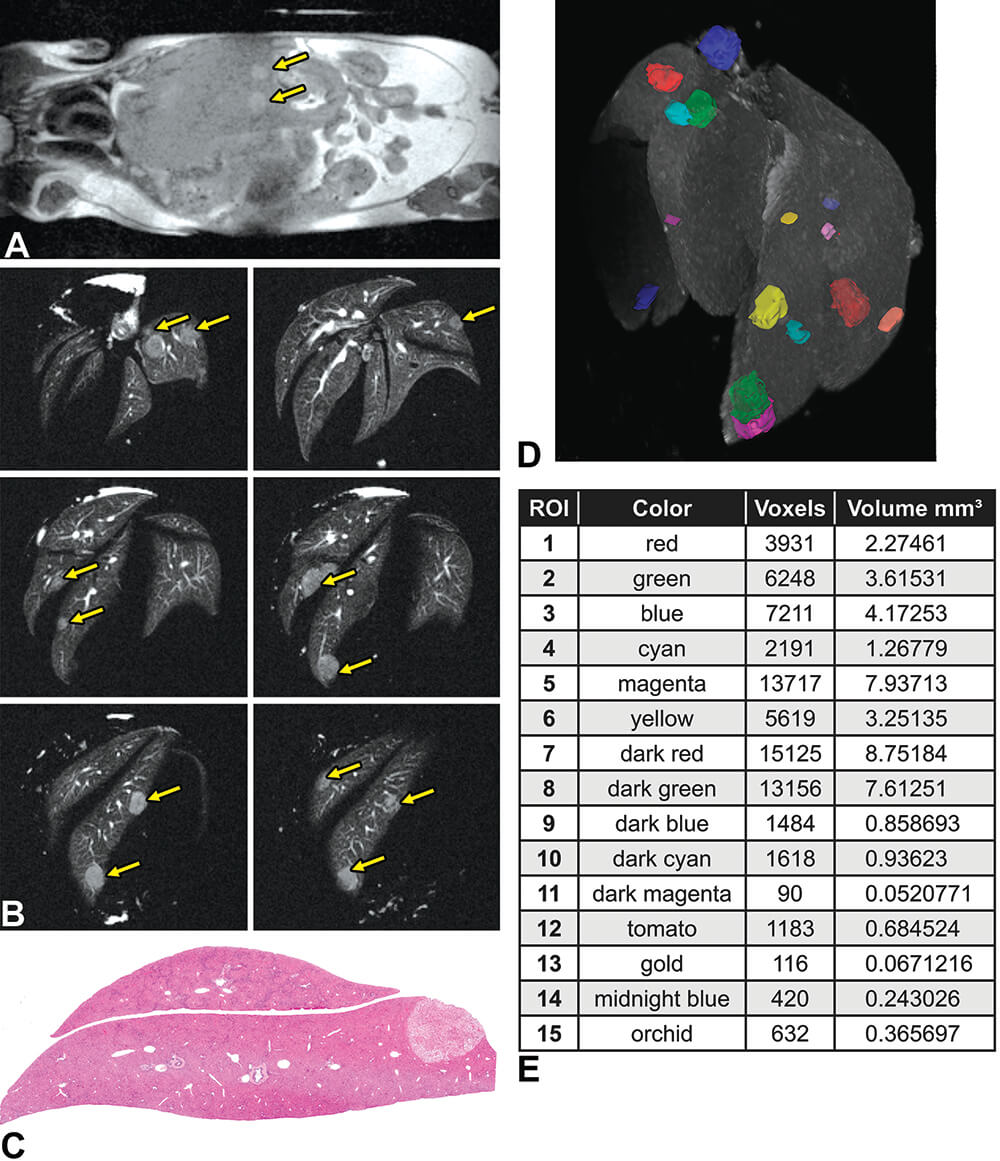
Figure 16. Focal liver lesions in Mdr−/− mice. A. In vivo magnetic resonance imaging (MRI) of a 14-month-old Mdr −/− mouse showing multiple focal lesions in the liver (arrows). MRI acquisition time was 3.50 minutes. B. Ex vivo MRI slices of the fixed liver showing different MRI slices of the fixed liver with many focal lesions (arrows). MRI acquisition time was 78.4 minutes. C. Histopathology of the liver showing the focal fatty change characteristics of the lesions. D. 3-Dimensional (3-D) presentation of a fixed liver with multiple focal fatty change lesions. Maximal intensity projection 3-D magnetic resonance rendering of the whole fixed liver showing the segmented focal lesions. E. Table summarizing the volume of each individual lesion. (Reprinted with permission of Tempel-Brami et al., 2015).
In a second anti-cancer testing model, Gl-261 murine glioma cell suspensions (105 cells) were stereotactically injected into the right brain of CB6F1 mice (Tempel-Brami et al., 2015). Tumor growth was noninvasively followed by in vivo MRI 20 days following cell injection. Tumor volume was measured noninvasively over time and found to have exponential growth (Figure 17). Moreover, in vivo MRI showed the variability in tumor size and location obtained for different animals, demonstrating the importance of longitudinal studies in the same animal rather than relying on statistics from groups of animals sacrificed at different intervals after injection. Ex vivo MRI of the perfused-fixed mouse head confirmed the in vivo data and correlated well with histopathology.
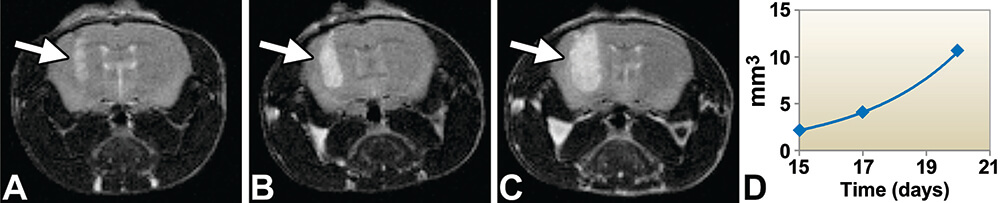
Figure 17. In vivo magnetic resonance imaging (MRI) of brain tumors generated in CB6F1 mice. Axial view of the time course of tumor growth in a tumor-bearing mouse head by in vivo MRI (yellow arrow). A-C. 15, 17 and 20 days after cell injection. Tumor identified by bright signal. D. Growth quantification detected an exponential growth shown in the graph. MRI acquisition time was 13.2 minutes. (Reprinted with permission of Tempel-Brami et al. 2015).
Pulmonary fibrosis
A model of pulmonary edema, inflammation, and fibrosis was obtained by single intratracheal installation of bleomycin in 6-week-old Sprague-Dawley rats. In vivo MRI of the rats was performed every day for 2 weeks with ex vivo MRI performed on air-inflated immersion-fixed lungs at the end of the two-weeks (Tempel-Brami et al., 2015). Repeated in vivo MRI on the same animal allowed longitudinal tracking of the progression and regression of the interstitial space occupying pathological processes manifesting as a bright signal against a black background. Ex vivo MRI in combination with conventional histology provided a cross-correlated quantitative assessment of the components of interstitial thickening (Figure 18 and 19). Based on the ability to longitudinally monitor and ultimately quantify the extent of interstitial disease, compact MRI in combination with conventional histopathology allows different treatments to be compared for their therapeutic effectiveness.
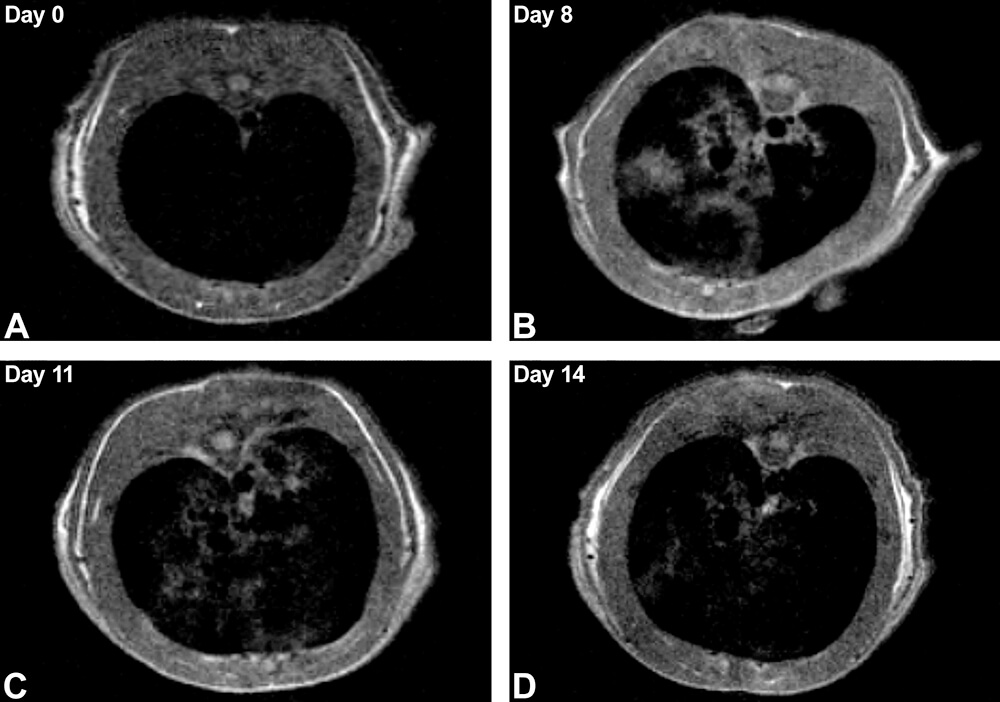
Figure 18. In vivo magnetic resonance imaging (MRI) of rat lungs. A-D. In vivo longitudinal follow-up of a rat over 14 days following intratracheal instillation of bleomycin. The transverse slices at the level of the lungs show progression of the edema, inflammation, and fibrosis manifested by irregular gray regions of magnetic resonance signal observed until day 11 (C) with trend to partial recovery on day 14 (D). MRI acquisition time was 4.3 minutes. (Reprinted with permission of Tempel-Brami et al. 2015).
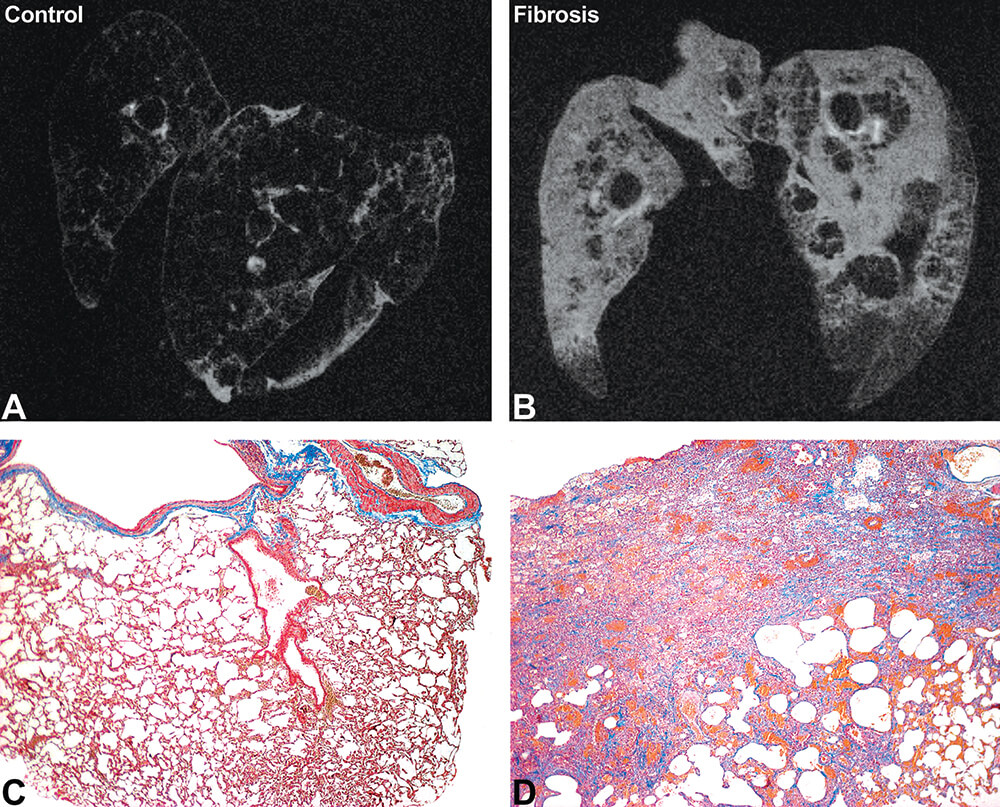
Figure 19. Ex vivo MRI and histopathology of lung edema, inflammation, and fibrosis in rats. Ex vivo MRI of control (A) and fibrotic (B) lung inflated with air and immersion fixed in formalin. Note the increased bright signal in the affected lung indicating combined inflammation and fibrosis. MRI acquisition time was 133 minutes. Histopathology staining by Masson’s Trichrome of the control (C) and fibrotic (D) lung 11 days following the administration of bleomycin. The fibrosis is highlighted by the blue staining. (Reprinted with permission of Tempel-Brami et al. 2015).
Examples of MALDI imaging applications in toxicity studies
MALDI imaging can be integrated directly in the workflow of the toxicologic investigations as described in Figure 20. In parallel or after the histologic examinations, tissue sections are analyzed to determine whether the lesions observed in tissues can be correlated with the administered molecule or one of its metabolites.
Some publications have described the utility of this approach in understanding the processes associated with toxicologic effects (Brignole-Baudouin et al., 2012, Brown et al., 2016, Bruinen et al., 2016, Groseclose et al., 2015, Nilsson et al., 2012). M. R. Groseclose et al. (Groseclose et al., 2015) have illustrated its application in an investigation of juvenile rat nephrotoxicity associated with dabrafenib (DAB) administration. DAB is an ATP-competitive inhibitor of RAF kinase activity and has been approved in adults for the treatment of tumors as monotherapy and combination therapy with Trametinib. The authors used MALDI imaging combined with microscopy to determine whether the tubular deposits observed in the treated juvenile rat kidneys were related to the drug and concluded that carboxy-DAB (CDAB, a DAB metabolite) was highly localized to the lumen of the damaged collecting ducts (Figure 21). Importantly, the authors have specified that neither CDAB itself nor any other DAB-related material was detected in the tubular luminal deposits.
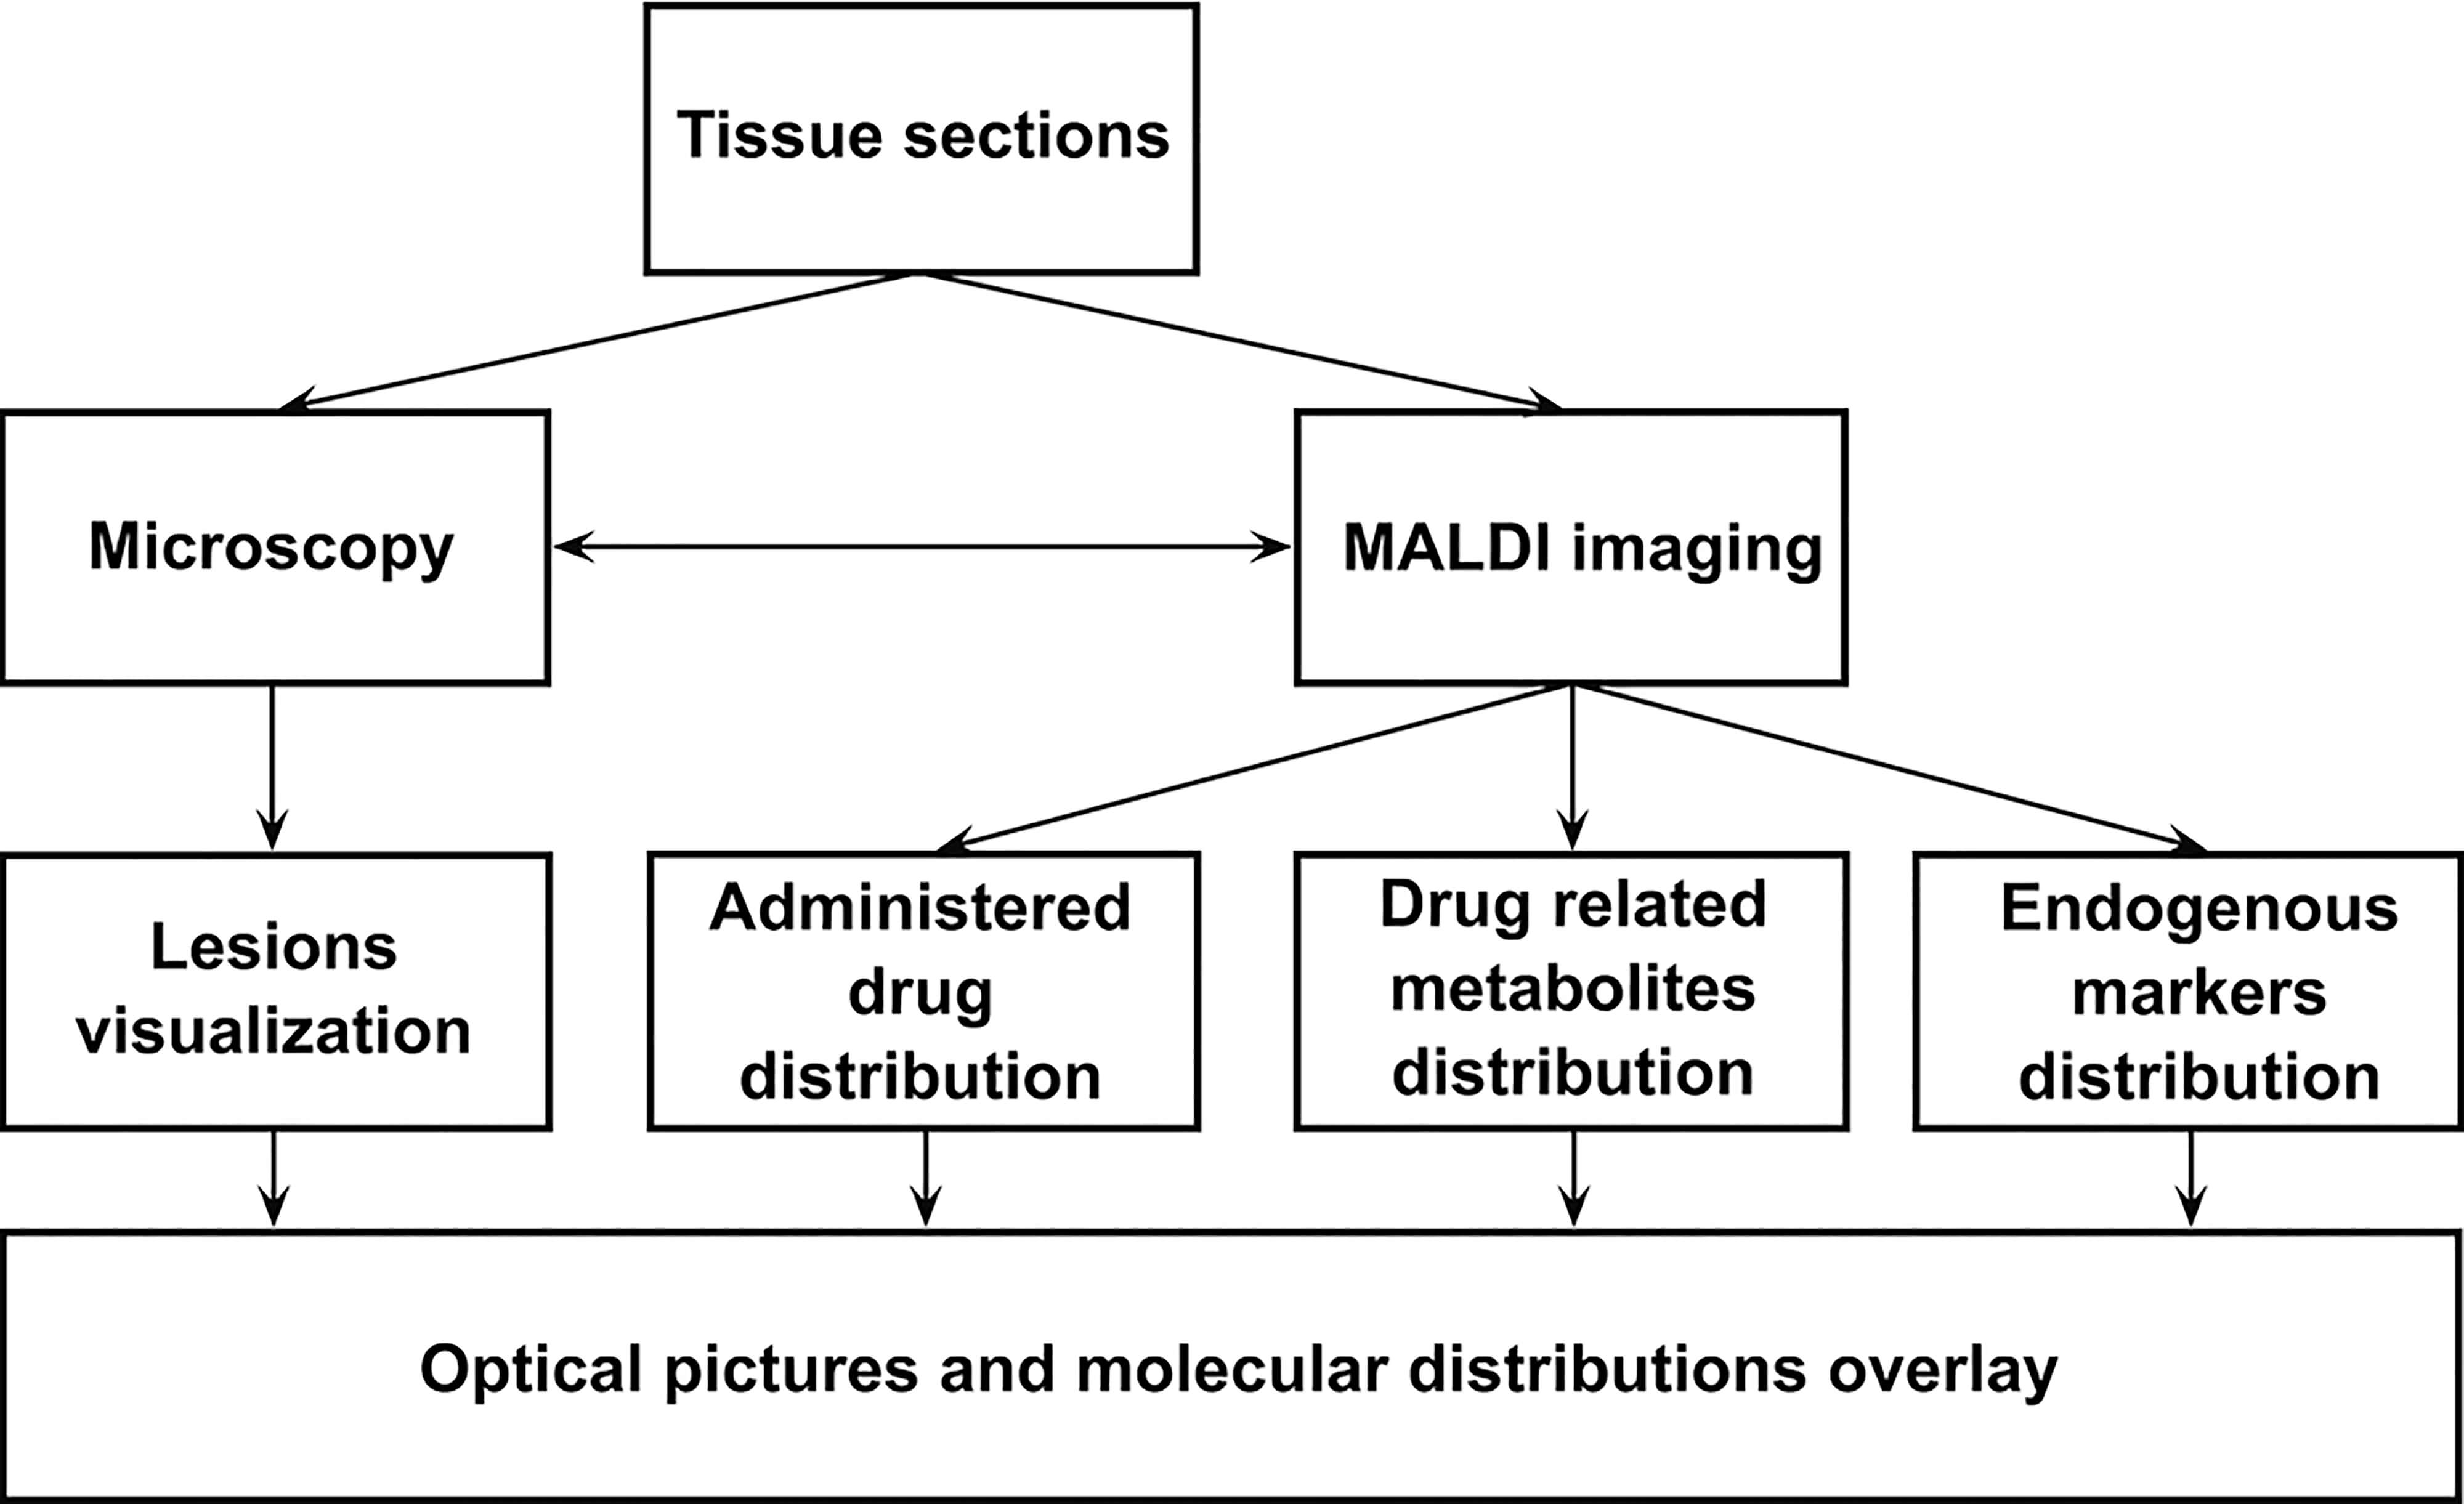
Figure 20. MALDI imaging applications in pathological investigations.
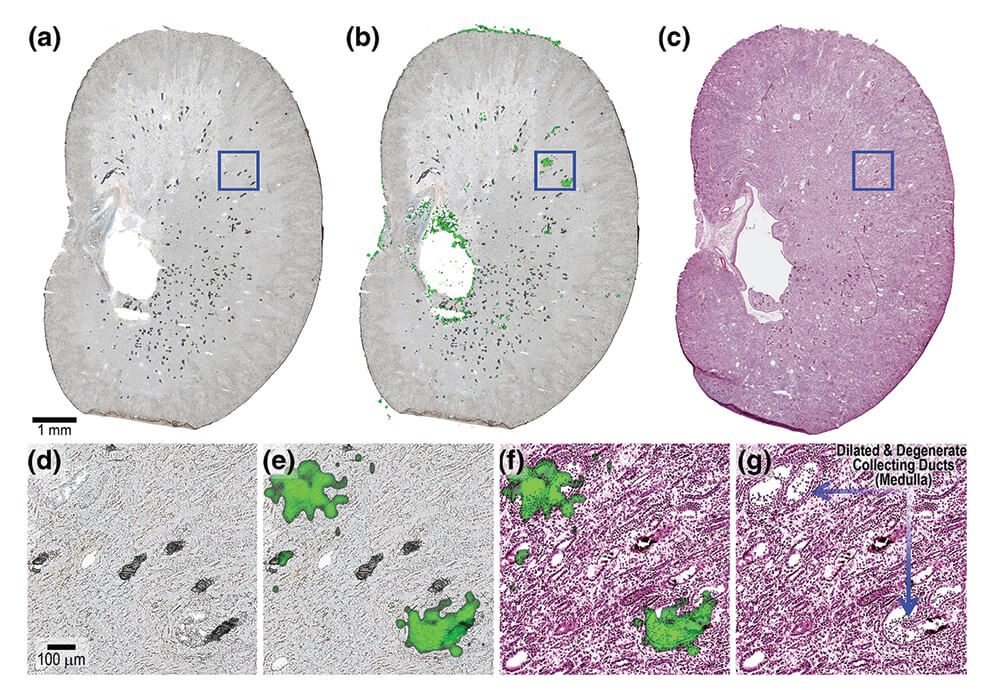
Figure 21. (a). Optical scan of kidney tissue sections from PND 7–13 juvenile rat G6-R2 analyzed by MALDI MSI in CASI mode (m/z460–620) at 25 μm spatial resolution. (b). Ion image for CDAB* [M + 2H + H]+ (m/z 508.1083). (c). Serial H&E. (d). 10× magnification of outlined region in optical scan. (e). Magnified view of CDAB ion image co-registered with optical scan. (f). Magnified view of CDAB ion image co-registered with H&E. (g). Magnified histopathology annotated. (Reprinted with permission from Groseclose et al., 2015).
MALDI Imaging also offers the opportunity to follow endogenous markers such as metabolites, lipids or peptides without any labeling. The detection of proteins may need a so-called bottom-up approach, i.e., involving a digestion on the tissue section. This step can be performed on the same tissue as the one used for the exogenous molecule detection. It is thus possible to monitor efficacy or toxicity markers. Figure 22 illustrates the detection of some endogenous metabolites in rat brain and liver. All these molecules were detected with the same acquisition method on the tissues. It is then easy to follow the impact of drugs on the toxicity markers by comparing different treatment regimens.
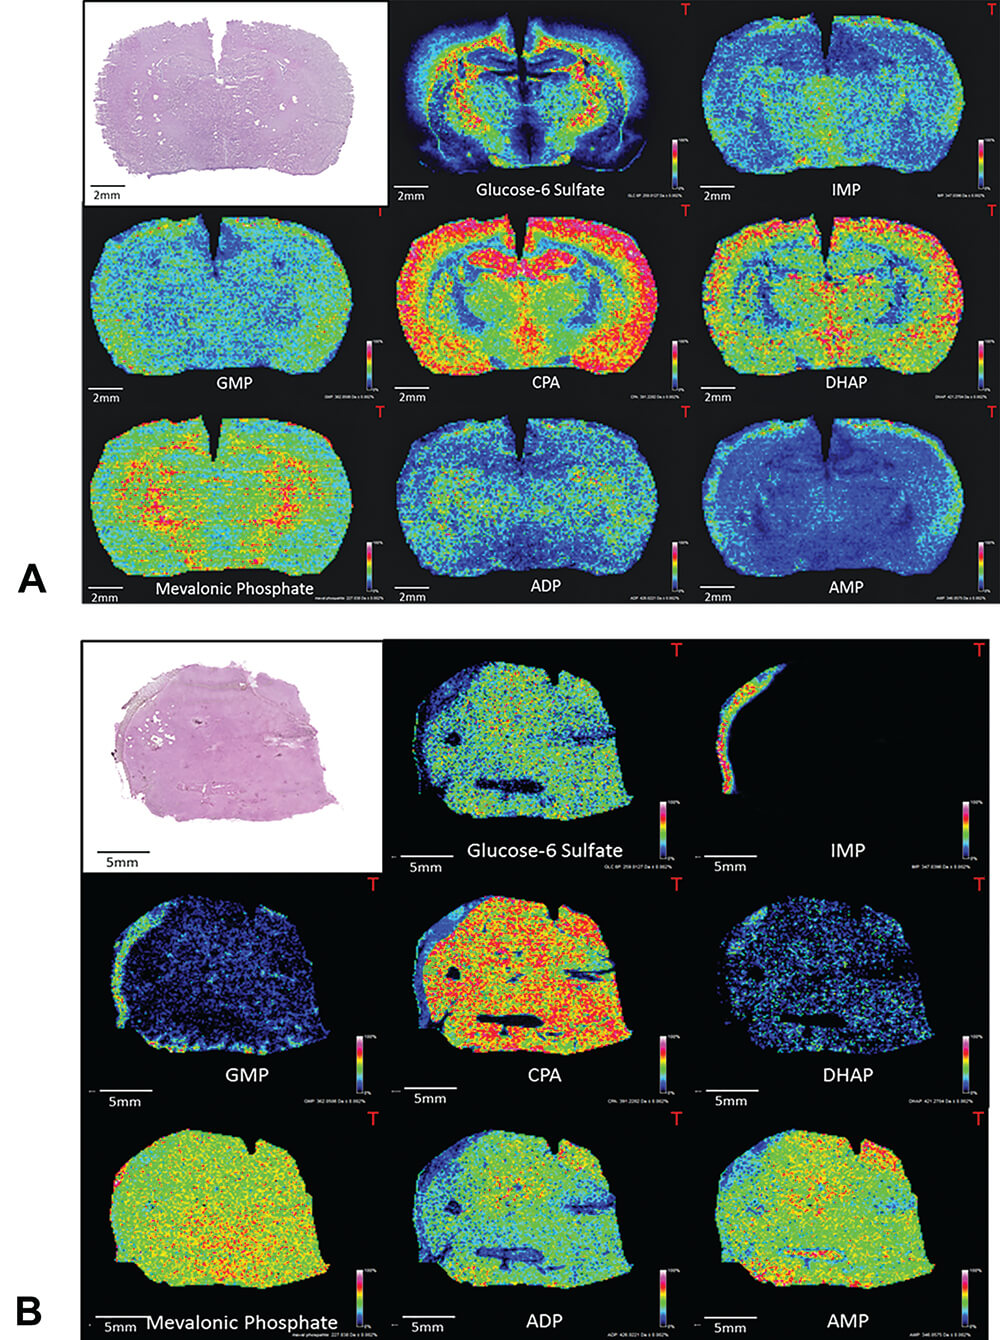
Figure 22. Examples of endogenous metabolite distributions obtained by MALDI imaging on rat brain (A) and liver (B). IMP: inosine monophosphate, GMP: guanosine monophosphate, CPA: cyclic phosphatidic acid, DHAP: dihydroxyacetone phosphate, ADP: adenosine diphosphate, AMP: adenosine monophosphate.
The detection of the endogenous metabolites involved in a specific pathway (such as the urea cycle, the citric acid cycle, and fatty acid synthesis) provides the opportunity to follow or study the impact of a treatment on these molecules or on the related enzymes. Figure 23 shows some metabolites detected in the glycolysis and Krebs cycle by MALDI imaging. In addition to providing the relative abundance of the targeted ions in the pathway, MSI provides spatial distribution that could help provide a deeper understanding of the biological mechanisms in histologic regions.
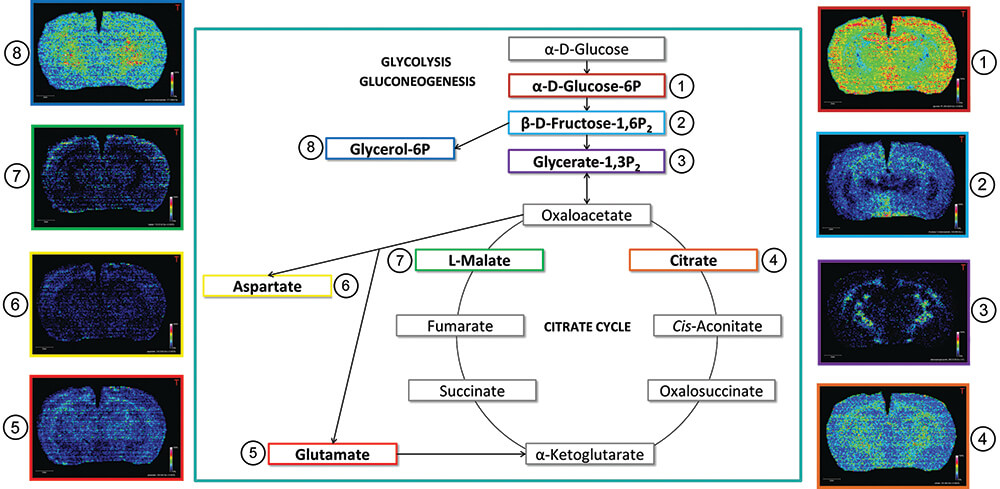
Figure 23. Glycolysis and Krebs cycle analysis by MALDI imaging on rat brain.
As mentioned above, targeting of the toxicity or inflammation markers can also be investigated during a safety evaluation and for some pharmacologic purposes (Caughlin et al., 2015, Lagarrigue et al., 2016, Meistermann et al., 2006). For example, lipofuscin is found as spherical particles in the retinal pigment epithelium (RPE) and characterized by its auto fluorescence when exposed to light. This exposure to light is known to produce reactive oxygen intermediates (ROI). The identification of one of the fluorophores in lipofuscin, N-retinylidene-N-retinylethanolamine (A2E), led to a variety of studies to understand its potential role in the phototoxicity of lipofuscin (Crouch et al., 2015). Figure 24 illustrates the A2E detection by MALDI imaging in an isolated rat eye section. The overlay between the H&E picture and the A2E molecular distribution confirms the specific localization of this endogenous marker in the RPE and shows the advantage of this multimodality approach.
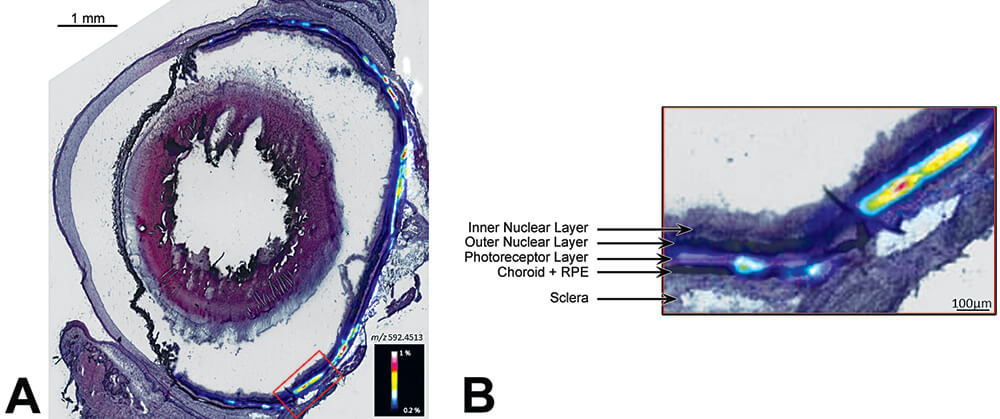
Figure 24. A. Specific distribution of A2E (a component of ocular lipofuscin) in a rat eye. B. High magnification of the retinal pigment epithelium (RPE) by MALDI imaging superposed with a H & E stained image.
Use of Imaging in Preclinical Study Regulatory Submissions
There is ample evidence showing the positive contribution of clinical imaging to medical diagnosis and biomedical science. Equipment is now available for bringing the same scientific sophistication to preclinical animal studies in support of basic toxicology research, drug development, and gaining regulatory support for new therapies. A logical and important next step is to gain regulatory acceptance of imaging data as part of preclinical data submissions at least on a case-by-case basis for regulatory filing and approval. Nonclinical imaging data can and have been successfully incorporated into regulatory submissions, but have generally been used on a case-by-case basis in a small subset of submissions to help address specific questions. Because the imaging data generated from these studies have the potential to become important components of regulatory submissions it is important to include measures to ensure data integrity and quality. The good news is that substantial effort at validation has already occurred with numerous examples in the peer-reviewed literature correlating imaging data with conventional histomorphology and function in preclinical studies (Tempel-Brami et al., 2015; Johnson et al., 2012; van Deel et al., 2016; Takimoto et al., 2005; Schiffenbauer et al., 2015; Ramot et al., 2017a). Examples are provided in the present manuscript. With respect to compliance with GLPs, imaging data are fundamentally electronic data and, thus, their generation and integrity can be completely tracked once the imaging equipment has been calibrated and the associated image processing software has been validated. Thus, although challenging, GLP compliance is achievable, especially for specific applications. In the meantime, the important contribution of imaging in preclinical drug discovery and development is still extant.
The September 2016 FDA draft proposal indicating that all nonclinical data intended to support a new drug application (NDA) filing should be conducted under GLP conditions sets the challenge for use of imaging in preclinical study regulatory submissions (FDA 2016). While the draft proposed changes to the Federal Register are still in the phase of review and have not yet been accepted, they have undoubtedly stimulated discussion as to how broadly or strictly such standards might be specifically applied to nonclinical imaging studies as well as an acknowledgement of some practical limitations to their application in imaging studies. Historically imaging data can and have been used to successfully support regulatory submissions, even if those data are not GLP compliant. At the same time, the FDA Critical Path Initiative clearly identifies an important need for imaging biomarkers (FDA 2017; FDA 2006). It is reasonable to expect that imaging biomarkers developed and submitted in preclinical studies could be potentially translatable to the clinical environment and would, therefore, be of interest to regulatory authorities. As technology and experience with imaging improves there is potential for future evolution of imaging to a more routine use in nonclinical studies to reduce the need for subchronic non-rodent studies. GLP status would likely be expected in such cases where imaging might be proposed as a replacement for some sacrifice time points.
Common components for achieving GLP compliance in preclinical studies include appropriate standard operating procedures (SOPs) for instrument calibration, maintenance, and use; validation of instruments and software; a system for archiving and retrieval of raw and calculated data; clearly defined roles, responsibilities and training for technical and professional staff, including the quality assurance (QA) staff; management oversight and accountability; and a QA program. These same components are needed for imaging studies to be GLP-compliant. However, the broad diversity of imaging modalities (e.g., MRI, ultrasound, CT, PET, SPECT, optical); differences in instrumentation and software for any given type of imaging; a seemingly infinite number of instrument setting combinations to be optimized for detection of specific morphologic and/or functional endpoints; organ- and tissue-specific image acquisition parameters; and animal handling procedures during imaging present unique challenges in achieving GLP compliance. Consequently, validation processes applicable to general toxicology are unlikely to be easily validated for all possible aspects of imaging processes. However, GLP-compliant tissue-specific functional and morphological imaging procedures such as echocardiograms, vascular perfusion, and rodent teratology evaluations should be achievable (van Deel et al., 2016; Badea et al., 2011; Yang et al., 2016; Wise et al., 2010).
Equipment validation procedures will need to be done in conjunction with the specific equipment vendors in setting up SOPs for daily and periodic preventive maintenance and calibration. In addition, image acquisition settings and animal handling parameters will often be dependent upon the organ system being studied; the method of anesthesia used; positioning of the animal for imaging; physiological monitoring before, during and after imaging; and software algorithms for translating instrument-generated signals into useable images. These and other components of the imaging process all need imaging-specific SOPs and controls. It is likely that standardized phantoms for each specific type of imaging will be needed to ensure proper functioning of imaging equipment and to confirm the accuracy, sensitivity, and precision of specific imaging protocols. Whenever possible, a specific imaging biomarker could be validated against a “gold standard.” An example of successful validation of imaging against an accepted “gold standard” is the application of micro CT imaging of fetal skeletons in developmental and reproductive toxicology studies (Wise et al., 2010; Wise and Winkelmann 2009a; Wise and Winkelmann 2009b; Winkelmann & Wise 2009). Here micro-CT methods were optimized to detect morphological changes in a single organ system (the skeleton) and results validated using comparison against an accepted standard (alizarin red stain). However, unlike the more traditional hematology, clinical chemistry and histopathology endpoints generally used in preclinical toxicology studies, full technical and analytical validation of imaging methods may be difficult to accomplish in the context of general toxicology studies. If an unanticipated need for imaging arises during a study, investigators may need to strike a reasonable balance between practical image acquisition and scientific rigor in optimizing imaging for the endpoint in question. Preferably, study-specific imaging document detailing the imaging procedure should be generated and incorporated in study protocols if a need for imaging is anticipated.
The reliability, quality, and integrity of electronic data used to obtain images are essential to track data processing and to reconstruct the process of generated images. Back-up and recovery procedures, providing an audit trail for complex data processing, and prevention of inadvertent image modification using “read only” critical files must be considered. Given the importance of computer-based processing during image acquisition and processing along with inevitable hardware changes and software upgrades, conditions will need to be provided to ensure legacy data will be useable. Because imaging equipment and how data are captured differ among vendor-specific imaging equipment, it is recommended that complete descriptions of hardware and software be associated with generated images.
In addition to development of SOPs and validation procedures mentioned above, rigorous data management and archiving procedures will be necessary for submission of GLP-compliant images. In addition to validating the electronic data that are processed to generate images, there are other associated data that must be considered, including metadata describing the image settings and quantitative data such as functional or volumetric measurements. To capture and archive qualitative image data, it should be possible to adapt existing data systems such as those used for gross and histopathology data. Lexicons using modality-specific diagnostic terminology can be created for imaging systems.
The assurance of scientific rigor in the process of generating and ultimately providing imaging data as part of regulatory submissions extends to the interpretation of qualitative endpoints of submitted images. Imaging studies almost invariably contain some element of qualitative morphologic assessment and comparison against a control. The training and experience of veterinary pathologists in qualitative morphologic assessments, along with additional formal training or credentials in understanding and interpretation of specific imaging modalities, makes them well-suited for this task. Alternatively, veterinary radiologists well-versed in different imaging modalities would be qualified to interpret study-related images and issue a formal interpretative report. Peer review could be implemented in a similar manner to the process used by anatomic pathologists. SOPs for peer review of image interpretation would include a defined tissue list and lexicon, identification of the subset of images to be reviewed, a written memo indicating what was reviewed including agreement (or disagreement) with the primary contributing scientist’s diagnoses, and a process for resolving differences between primary and peer review scientists. Final conclusions from the imaging data would then be added to the study report for regulatory submission. Raw data would be defined as the signed image evaluation report. This could be an independent stand-alone imaging report or a component of the pathology report.
Discussion
Use of different imaging modalities (e.g. MRI, CT and ultrasound) in the preclinical testing environment has made substantial contributions in drug development, understanding dynamic and functional aspects of disease, characterizing animal models of human disease, generation of quantitative data in longitudinal studies by imaging the same animals throughout a study, and as an important adjunct to conventional study endpoints such as histopathology (Tempel-Brami et al., 2015; Johnson et al., 2012; van Deel et al., 2016; Takimoto et al., 2005; Gabrielson et al., 2008). In addition, imaging modalities proven useful in preclinical studies are often readily translatable to the clinical environment.
Available imaging systems range in complexity of use with a wide spread of relative costs. Basic protocols for ultrasound and optical imaging are relatively easy to use, equipment is relatively inexpensive, and these imaging modalities could be added to standard toxicology studies relatively easily with minimal animal manipulation. For imaging modalities such as in vivo PET/SPECT, CT, and MR animal anesthesia is required and are best carried out as stand-alone studies. Conventional PET/SPECT, CT, and MRI systems are expensive and require operating infrastructure and housing details restricting their use to large academic, industrial, and contract research organization facilities. A notable exception is the new compact MRI system that is portable, easy to use, and without the infrastructure and safety concerns associated with conventional MRI facilities (Ramot et al., 2017b). MALDI-MSI is currently limited to specialized academic groups, some large pharmaceutical companies, and a few CROs, has a relatively high cost, and requires a high level of personnel training for operation and interpretation. However, MALDI-MSI provides highly relevant detail on tissue localization of test agent and metabolites not achievable by other imaging modalities, is label-free, and has high specificity and sensitivity making it an increasingly important tool in toxicology investigations and safety evaluation.
We have provided representative and practical examples of imaging applications of ultrasound, PET/SPECT, optical, MRI and MALDI as adjuncts to conventional toxicology and toxicologic pathology parameters. These examples have relatively straightforward imaging protocols. However, advances in instrumentation and image acquisition parameters reflect a rapidly expanding imaging armamentarium providing us with increasing ability to enhance the science and effectiveness of our preclinical studies. We admit there are challenges in making many aspects of imaging GLP-compliant. Nevertheless, we encourage submission of imaging data as part of regulatory submissions on a case-by-case basis to answer specific questions when warranted and provided data are rigorously generated and scientifically sound. We believe imaging data will be useful in many cases for informing regulatory decisions even if not yet completely GLP-compliant.
References
Ashton, J. R., West, J. L., and Badea, C. T. (2015). In vivo small animal micro-ct using nanoparticle contrast agents. Front Pharmacol 6, 256.
Badea, C., Hedlund, L. W., and Johnson, G. A. (2004). Micro-ct with respiratory and cardiac gating. Med Phys 31, 3324-9.
Badea, C. T., Fubara, B., Hedlund, L. W., and Johnson, G. A. (2005). 4-d micro-ct of the mouse heart. Mol Imaging 4, 110-6.
Badea, C. T., Hedlund, L. W., Cook, J., Berridge, B. R., and Johnson, G. A. (2011). Micro-ct imaging assessment of dobutamine-induced cardiac stress in rats. J Pharmacol Toxicol Methods 63, 24-9.
Bennink, R. J., Peeters, M., Rutgeerts, P., and Mortelmans, L. (2004). Evaluation of early treatment response and predicting the need for colectomy in active ulcerative colitis with 99mtc-hmpao white blood cell scintigraphy. J Nucl Med 45, 1698-704.
Bernsen, M. R., Vaissier, P. E., Van Holen, R., Booij, J., Beekman, F. J., and de Jong, M. (2014). The role of preclinical spect in oncological and neurological research in combination with either ct or mri. Eur J Nucl Med Mol Imaging 41 Suppl 1, S36-49.
Bettegowda, C., Foss, C. A., Cheong, I., Wang, Y., Diaz, L., Agrawal, N., Fox, J., Dick, J., Dang, L. H., Zhou, S., Kinzler, K. W., Vogelstein, B., and Pomper, M. G. (2005). Imaging bacterial infections with radiolabeled 1-(2′-deoxy-2′-fluoro-beta-d-arabinofuranosyl)-5-iodouracil. Proc Natl Acad Sci U S A 102, 1145-50.
Bhang, H. E., Gabrielson, K. L., Laterra, J., Fisher, P. B., and Pomper, M. G. (2011). Tumor-specific imaging through progression elevated gene-3 promoter-driven gene expression. Nature Medicine 17, 123-9.
Bhatnagar, A., Wang, Y., Mease, R. C., Gabrielson, M., Sysa, P., Minn, I., Green, G., Simmons, B., Gabrielson, K., Sarkar, S., Fisher, P. B., and Pomper, M. G. (2014). Aeg-1 promoter-mediated imaging of prostate cancer. Cancer Research 74, 5772-81.
Bonnel, D., Legouffe, R., Willand, N., Baulard, A., Hamm, G., Deprez, B., and Stauber, J. (2011a). Maldi imaging techniques dedicated to drug-distribution studies. Bioanalysis 3, 1399-406.
Bonnel, D., Longuespee, R., Franck, J., Roudbaraki, M., Gosset, P., Day, R., Salzet, M., and Fournier, I. (2011b). Multivariate analyses for biomarkers hunting and validation through on-tissue bottom-up or in-source decay in maldi-msi: Application to prostate cancer. Anal Bioanal Chem 401, 149-65.
Breckwoldt, M. O., Pfister, F. M., Bradley, P. M., Marinkovic, P., Williams, P. R., Brill, M. S., Plomer, B., Schmalz, A., St Clair, D. K., Naumann, R., Griesbeck, O., Schwarzlander, M., Godinho, L., Bareyre, F. M., Dick, T. P., Kerschensteiner, M., and Misgeld, T. (2014). Multiparametric optical analysis of mitochondrial redox signals during neuronal physiology and pathology in vivo. Nature Medicine 20, 555-60.
Brignole-Baudouin, F., Desbenoit, N., Hamm, G., Liang, H., Both, J. P., Brunelle, A., Fournier, I., Guerineau, V., Legouffe, R., Stauber, J., Touboul, D., Wisztorski, M., Salzet, M., Laprevote, O., and Baudouin, C. (2012). A new safety concern for glaucoma treatment demonstrated by mass spectrometry imaging of benzalkonium chloride distribution in the eye, an experimental study in rabbits. PLoS One 7, e50180.
Brown, H. R., Castellino, S., Groseclose, M. R., Elangbam, C. S., Mellon-Kusibab, K., Yoon, L. W., Gates, L. D., Krull, D. L., Cariello, N. F., Arrington-Brown, L., Tillman, T., Fowler, S., Shah, V., Bailey, D., and Miller, R. T. (2016). Drug-induced liver fibrosis: Testing nevirapine in a viral-like liver setting using histopathology, maldi ims, and gene expression. Toxicol Pathol 44, 112-31.
Brown, R. H., Irvin, C. G., Allen, G. B., 3rd, Shapiro, S. D., Martin, W. J., Kolb, M. R., Hyde, D. M., Nieman, G. F., Cody, D. D., Ishii, M., Kadlecek, S. J., Driehuys, B., Rizi, R. R., Wu, A. M., Weber, W. A., Stout, D. B., and Subcommittee, A. T. S. S. A. I. (2008). An official ats conference proceedings: Advances in small-animal imaging application to lung pathophysiology. Proc Am Thorac Soc 5, 591-600.
Bruinen, A. L., van Oevelen, C., Eijkel, G. B., Van Heerden, M., Cuyckens, F., and Heeren, R. M. (2016). Mass spectrometry imaging of drug related crystal-like structures in formalin-fixed frozen and paraffin-embedded rabbit kidney tissue sections. J Am Soc Mass Spectrom 27, 117-23.
Buck, A., Balluff, B., Voss, A., Langer, R., Zitzelsberger, H., Aichler, M., and Walch, A. (2016). How suitable is matrix-assisted laser desorption/ionization-time-of-flight for metabolite imaging from clinical formalin-fixed and paraffin-embedded tissue samples in comparison to matrix-assisted laser desorption/ionization-fourier transform ion cyclotron resonance mass spectrometry. Analytical Chemistry 88, 5281-9.
Burton, N. C., Patel, M., Morscher, S., Driessen, W. H., Claussen, J., Beziere, N., Jetzfellner, T., Taruttis, A., Razansky, D., Bednar, B., and Ntziachristos, V. (2013). Multispectral opto-acoustic tomography (msot) of the brain and glioblastoma characterization. NeuroImage 65, 522-8.
Caprioli, R. M., Farmer, T. B., and Gile, J. (1997). Molecular imaging of biological samples: Localization of peptides and proteins using maldi-tof ms. Anal Chem 69, 4751-60.
Castellino, S., Groseclose, M. R., and Wagner, D. (2011). Maldi imaging mass spectrometry: Bridging biology and chemistry in drug development. Bioanalysis 3, 2427-41.
Caughlin, S., Hepburn, J. D., Park, D. H., Jurcic, K., Yeung, K. K., Cechetto, D. F., and Whitehead, S. N. (2015). Increased expression of simple ganglioside species gm2 and gm3 detected by maldi imaging mass spectrometry in a combined rat model of abeta toxicity and stroke. PLoS One 10, e0130364.
Cavanaugh, D., Johnson, E., Price, R. E., Kurie, J., Travis, E. L., and Cody, D. D. (2004). In vivo respiratory-gated micro-ct imaging in small-animal oncology models. Mol Imaging 3, 55-62.
Chatziioannou, A. F. (2005). Instrumentation for molecular imaging in preclinical research: Micro-pet and micro-spect. Proc Am Thorac Soc 2, 533-6, 510-11.
Chaurand, P., and Caprioli, R. M. (2002). Direct profiling and imaging of peptides and proteins from mammalian cells and tissue sections by mass spectrometry. Electrophoresis 23, 3125-35.
Chaurand, P., Stoeckli, M., and Caprioli, R. M. (1999). Direct profiling of proteins in biological tissue sections by maldi mass spectrometry. Analytical Chemistry 71, 5263-70.
Corson, T. W., Samuels, B. C., Wenzel, A. A., Geary, A. J., Riley, A. A., McCarthy, B. P., Hanenberg, H., Bailey, B. J., Rogers, P. I., Pollok, K. E., Rajashekhar, G., and Territo, P. R. (2014). Multimodality imaging methods for assessing retinoblastoma orthotopic xenograft growth and development. PLoS One 9, e99036.
Crouch, R. K., Koutalos, Y., Kono, M., Schey, K., and Ablonczy, Z. (2015). A2e and lipofuscin. Prog Mol Biol Transl Sci 134, 449-63.
Dimasi, J. A. (2001). Risks in new drug development: Approval success rates for investigational drugs. Clin Pharmacol Ther 69, 297-307.
Dufort, S., Sancey, L., Wenk, C., Josserand, V., and Coll, J. L. (2010). Optical small animal imaging in the drug discovery process. Biochim Biophys Acta 1798, 2266-73.
Ellery, S. J., Cai, X., Walker, D. D., Dickinson, H., and Kett, M. M. (2015). Transcutaneous measurement of glomerular filtration rate in small rodents: Through the skin for the win? Nephrology (Carlton) 20, 117-23.
FDA (2006). Critical path opportunities list, https://www.fda.gov/downloads/ScienceResearch/SpecialTopics/CriticalPathInitiative/CriticalPathOpportunitiesReports/UCM077258.pdf.
FDA (2016). Good laboratory practice for nonclinical laboratory studies, https://www.federalregister.gov/documents/2016/08/24/2016-19875/good-laboratory-practice-for-nonclinical-laboratory-studies.
FDA (2017). Critical path initiative, http://www.fda.gov/ScienceResearch/SpecialTopics/CriticalPathInitiative/.
Filonov, G. S., Piatkevich, K. D., Ting, L. M., Zhang, J., Kim, K., and Verkhusha, V. V. (2011). Bright and stable near-infrared fluorescent protein for in vivo imaging. Nat Biotechnol 29, 757-61.
Franc, B. L., Acton, P. D., Mari, C., and Hasegawa, B. H. (2008). Small-animal spect and spect/ct: Important tools for preclinical investigation. J Nucl Med 49, 1651-63.
Franck, J., Arafah, K., Elayed, M., Bonnel, D., Vergara, D., Jacquet, A., Vinatier, D., Wisztorski, M., Day, R., Fournier, I., and Salzet, M. (2009). Maldi imaging mass spectrometry: State of the art technology in clinical proteomics. Mol Cell Proteomics 8, 2023-33.
Gabrielson, K., Bedja, D., Pin, S., Tsao, A., Gama, L., Yuan, B., and Muratore, N. (2007). Heat shock protein 90 and erbb2 in the cardiac response to doxorubicin injury. Cancer Res 67, 1436-41.
Gabrielson, K. L., Mok, G. S., Nimmagadda, S., Bedja, D., Pin, S., Tsao, A., Wang, Y., Sooryakumar, D., Yu, S. J., Pomper, M. G., and Tsui, B. M. (2008). Detection of dose response in chronic doxorubicin-mediated cell death with cardiac technetium 99m annexin v single-photon emission computed tomography. Molecular Imaging 7, 132-8.
Groseclose, M. R., Laffan, S. B., Frazier, K. S., Hughes-Earle, A., and Castellino, S. (2015). Imaging ms in toxicology: An investigation of juvenile rat nephrotoxicity associated with dabrafenib administration. J Am Soc Mass Spectrom 26, 887-98.
Groseclose, M. R., Massion, P. P., Chaurand, P., and Caprioli, R. M. (2008). High-throughput proteomic analysis of formalin-fixed paraffin-embedded tissue microarrays using maldi imaging mass spectrometry. Proteomics 8, 3715-24.
Habashi, J. P., Judge, D. P., Holm, T. M., Cohn, R. D., Loeys, B. L., Cooper, T. K., Myers, L., Klein, E. C., Liu, G., Calvi, C., Podowski, M., Neptune, E. R., Halushka, M. K., Bedja, D., Gabrielson, K., Rifkin, D. B., Carta, L., Ramirez, F., Huso, D. L., and Dietz, H. C. (2006). Losartan, an at1 antagonist, prevents aortic aneurysm in a mouse model of marfan syndrome. Science 312, 117-21.
Hamm, G., Bonnel, D., Legouffe, R., Pamelard, F., Delbos, J. M., Bouzom, F., and Stauber, J. (2012). Quantitative mass spectrometry imaging of propranolol and olanzapine using tissue extinction calculation as normalization factor. J Proteomics 75, 4952-61.
Hanig, J., Paule, M. G., Ramu, J., Schmued, L., Konak, T., Chigurupati, S., Slikker, W., Jr., Sarkar, S., and Liachenko, S. (2014). The use of mri to assist the section selections for classical pathology assessment of neurotoxicity. Regul Toxicol Pharmacol 70, 641-7.
Harb, R., Whiteus, C., Freitas, C., and Grutzendler, J. (2013). In vivo imaging of cerebral microvascular plasticity from birth to death. J Cereb Blood Flow Metab 33, 146-56.
Hinson, J. A., Roberts, D. W., and James, L. P. (2010). Mechanisms of acetaminophen-induced liver necrosis. Handb Exp Pharmacol, 369-405.
Hirano, T. (2016). Molecular origin of color variation in firefly (beetle) bioluminescence: A chemical basis for biological imaging. Curr Top Med Chem 16, 2638-47.
Hudson, S. V., Huang, J. S., Yin, W., Albeituni, S., Rush, J., Khanal, A., Yan, J., Ceresa, B. P., Frieboes, H. B., and McNally, L. R. (2014). Targeted noninvasive imaging of egfr-expressing orthotopic pancreatic cancer using multispectral optoacoustic tomography. Cancer Research 74, 6271-9.
Johnson, G. A., Calabrese, E., Badea, A., Paxinos, G., and Watson, C. (2012). A multidimensional magnetic resonance histology atlas of the wistar rat brain. Neuroimage 62, 1848-56.
Joshi, S., Ergin, A., Wang, M., Reif, R., Zhang, J., Bruce, J. N., and Bigio, I. J. (2011). Inconsistent blood brain barrier disruption by intraarterial mannitol in rabbits: Implications for chemotherapy. J Neurooncol 104, 11-9.
Kalchenko, V., Israeli, D., Kuznetsov, Y., and Harmelin, A. (2014a). Transcranial optical vascular imaging (tovi) of cortical hemodynamics in mouse brain. Sci Rep 4, 5839.
Kalchenko, V., Kuznetsov, Y., Preise, D., Meglinski, I., and Harmelin, A. (2014b). Ear swelling test by using laser speckle imaging with a long exposure time. J Biomed Opt 19, 060502.
Kalchenko, V., Madar-Balakirski, N., Meglinski, I., and Harmelin, A. (2011). In vivo characterization of tumor and tumor vascular network using multi-modal imaging approach. J Biophotonics 4, 645-9.
Kalchenko, V., Ziv, K., Addadi, Y., Madar-Balakirski, N., Meglinski, I., and Neeman, M. (2010). Combined application of dynamic light scattering imaging and fluorescence intravital microscopy in vascular biology. Laser Phys. Lett. 7, 603–606.
Khalil, M. M., Tremoleda, J. L., Bayomy, T. B., and Gsell, W. (2011). Molecular spect imaging: An overview. Int J Mol Imaging 2011, 796025.
Kiessling, F., Fokong, S., Koczera, P., Lederle, W., and Lammers, T. (2012). Ultrasound microbubbles for molecular diagnosis, therapy, and theranostics. J Nucl Med 53, 345-8.
Kreye, F., Hamm, G., Karrout, Y., Legouffe, R., Bonnel, D., Siepmann, F., and Siepmann, J. (2012). Maldi-tof ms imaging of controlled release implants. J Control Release 161, 98-108.
Lagarrigue, M., Caprioli, R. M., and Pineau, C. (2016). Potential of maldi imaging for the toxicological evaluation of environmental pollutants. Journal of Proteomics 144, 133-9.
Lemaire, R., Desmons, A., Tabet, J. C., Day, R., Salzet, M., and Fournier, I. (2007). Direct analysis and maldi imaging of formalin-fixed, paraffin-embedded tissue sections. J Proteome Res 6, 1295-305.
Lombardi, C. M., Zambelli, V., Botta, G., Moltrasio, F., Cattoretti, G., Lucchini, V., Fesslova, V., and Cuttin, M. S. (2014). Postmortem microcomputed tomography (micro-ct) of small fetuses and hearts. Ultrasound Obstet Gynecol 44, 600-9.
Martiniova, L., Schimel, D., Lai, E. W., Limpuangthip, A., Kvetnansky, R., and Pacak, K. (2010). In vivo micro-ct imaging of liver lesions in small animal models. Methods 50, 20-5.
Meistermann, H., Norris, J. L., Aerni, H. R., Cornett, D. S., Friedlein, A., Erskine, A. R., Augustin, A., De Vera Mudry, M. C., Ruepp, S., Suter, L., Langen, H., Caprioli, R. M., and Ducret, A. (2006). Biomarker discovery by imaging mass spectrometry: Transthyretin is a biomarker for gentamicin-induced nephrotoxicity in rat. Mol Cell Proteomics 5, 1876-86.
Moses, W. W. (2011). Fundamental limits of spatial resolution in pet. Nucl Instrum Methods Phys Res A 648 Supplement 1, S236-S240.
Mossanen, J. C., and Tacke, F. (2015). Acetaminophen-induced acute liver injury in mice. Lab Anim 49, 30-6.
Ng, C. M., Cheng, A., Myers, L. A., Martinez-Murillo, F., Jie, C., Bedja, D., Gabrielson, K. L., Hausladen, J. M., Mecham, R. P., Judge, D. P., and Dietz, H. C. (2004). Tgf-beta-dependent pathogenesis of mitral valve prolapse in a mouse model of marfan syndrome. J Clin Invest 114, 1586-92.
Nilsson, A., Forngren, B., Bjurstrom, S., Goodwin, R. J., Basmaci, E., Gustafsson, I., Annas, A., Hellgren, D., Svanhagen, A., Andren, P. E., and Lindberg, J. (2012). In situ mass spectrometry imaging and ex vivo characterization of renal crystalline deposits induced in multiple preclinical drug toxicology studies. PLoS One 7, e47353.
Nyska, A., Schiffenbauer, Y. S., Brami, C. T., Maronpot, R. R., and Ramot, Y. (2014). Histopathology of biodegradable polymers: Challenges in interpretation and the use of novel compact mri for biocompatibility evaluation. Polymer. Adv. Tech. 25, 461-467.
Parasuraman, S. (2011). Toxicological screening. J Pharmacol Pharmacother 2, 74-9.
Peterson, J. (2013). GFR-vivo 680 fluorescent imaging agent. Application note., pp. 1-7, https://www.perkinelmer.com/lab-solutions/resources/docs/APP_010996_01_GFR_Vivo680.pdf.
Pietrowska, M., Gawin, M., Polanska, J., and Widlak, P. (2016). Tissue fixed with formalin and processed without paraffin embedding is suitable for imaging of both peptides and lipids by MALDI-IMS. Proteomics 16, 1670-7.
Prideaux, B., Dartois, V., Staab, D., Weiner, D. M., Goh, A., Via, L. E., Barry, C. E., 3rd, and Stoeckli, M. (2011). High-sensitivity maldi-mrm-ms imaging of moxifloxacin distribution in tuberculosis-infected rabbit lungs and granulomatous lesions. Analytical chemistry 83, 2112-8.
Prideaux, B., Staab, D., and Stoeckli, M. (2010). Applications of MALDI-IMS to pharmaceutical research. Methods in Molecular Biology 656, 405-13.
Prideaux, B., and Stoeckli, M. (2012). Mass spectrometry imaging for drug distribution studies. Journal of Proteomics 75, 4999-5013.
Ramachandran, R., and Kakar, S. (2009). Histological patterns in drug-induced liver disease. J Clin Pathol 62, 481-92.
Ramot, Y., Schiffenbauer, Y. S., Amouyal, N., Ezov, N., Steiner, M., Izrael, M., Lavon, N., Hasson, A., Revel, M., and Nyska, A. (2017a). Compact mri for the detection of teratoma development following intrathecal human embryonic stem cell injection in nod-scid mice. Neurotoxicology 59, 27-32.
Ramot, Y., Schiffenbauer, Y. S., Maronpot, R., and Nyska, A. (2017b). Compact magnetic resonance imaging systems – novel cost-effective tools for preclinical drug safety and efficacy evaluation. Toxicological Sciences In press.
Rueckel, J., Stockmar, M., Pfeiffer, F., and Herzen, J. (2014). Spatial resolution characterization of a x-ray microct system. Appl Radiat Isot 94, 230-4.
Scarfe, L., Rak-Raszewska, A., Geraci, S., Darssan, D., Sharkey, J., Huang, J., Burton, N. C., Mason, D., Ranjzad, P., Kenny, S., Gretz, N., Levy, R., Kevin Park, B., Garcia-Finana, M., Woolf, A. S., Murray, P., and Wilm, B. (2015). Measures of kidney function by minimally invasive techniques correlate with histological glomerular damage in scid mice with adriamycin-induced nephropathy. Sci Rep 5, 13601.
Scherfler, C., Donnemiller, E., Schocke, M., Dierkes, K., Decristoforo, C., Oberladstatter, M., Kolbitsch, C., Zschiegner, F., Riccabona, G., Poewe, W., and Wenning, G. (2002). Evaluation of striatal dopamine transporter function in rats by in vivo beta-[123i]cit pinhole spect. NeuroImage 17, 128-41.
Shao, Y., Cherry, S., Farahani, K., Meadors, K., Siegel, S., Silverman, R., and Marsden, P. (1997). Simultaneous pet and mr imaging. Phys Med Biol 42, 1965-1970.
Shuhendler, A. J., Pu, K., Cui, L., Uetrecht, J. P., and Rao, J. (2014). Real-time imaging of oxidative and nitrosative stress in the liver of live animals for drug-toxicity testing. Nat Biotechnol 32, 373-80.
Solomon, H. M., Makris, S. L., Alsaid, H., Bermudez, O., Beyer, B. K., Chen, A., Chen, C. L., Chen, Z., Chmielewski, G., DeLise, A. M., de Schaepdrijver, L., Dogdas, B., French, J., Harrouk, W., Helfgott, J., Henkelman, R. M., Hesterman, J., Hew, K. W., Hoberman, A., Lo, C. W., McDougal, A., Minck, D. R., Scott, L., Stewart, J., Sutherland, V., Tatiparthi, A. K., Winkelmann, C. T., Wise, L. D., Wood, S. L., and Ying, X. (2016). Micro-ct imaging: Developing criteria for examining fetal skeletons in regulatory developmental toxicology studies – a workshop report. Regul Toxicol Pharmacol 77, 100-8.
Solon, E. G., Schweitzer, A., Stoeckli, M., and Prideaux, B. (2010). Autoradiography, maldi-ms, and sims-ms imaging in pharmaceutical discovery and development. AAPS J 12, 11-26.
Sorensen, L. L., Bedja, D., Sysa-Shah, P., Liu, H., Maxwell, A., Yi, X., Pozios, I., Olsen, N. T., Abraham, T. P., Abraham, R., and Gabrielson, K. (2016). Echocardiographic characterization of a murine model of hypertrophic obstructive cardiomyopathy induced by cardiac-specific overexpression of epidermal growth factor receptor 2. Comp Med 66, 268-77.
Stauber, J., Lemaire, R., Franck, J., Bonnel, D., Croix, D., Day, R., Wisztorski, M., Fournier, I., and Salzet, M. (2008). Maldi imaging of formalin-fixed paraffin-embedded tissues: Application to model animals of Parkinson disease for biomarker hunting. J Proteome Res 7, 969-78.
Stein, E. W., Maslov, K., and Wang, L. V. (2009). Noninvasive, in vivo imaging of the mouse brain using photoacoustic microscopy. J Appl Phys 105, 102027.
Stoeckli, M., Chaurand, P., Hallahan, D. E., and Caprioli, R. M. (2001). Imaging mass spectrometry: A new technology for the analysis of protein expression in mammalian tissues. Nature Medicine 7, 493-6.
Stoeckli, M., Staab, D., and Schweitzer, A. (2007 ). Compound and metabolite distribution measured by maldi mass spectrometric imaging in whole-body tissue sections. Int. J Mass Spectrom. 260, 195-202.
Sun, N., Fernandez, I. E., Wei, M., Wu, Y., Aichler, M., Eickelberg, O., and Walch, A. (2016). Pharmacokinetic and pharmacometabolomic study of pirfenidone in normal mouse tissues using high mass resolution maldi-fticr-mass spectrometry imaging. Histochem Cell Biol 145, 201-11.
Sysa-Shah, P., Xu, Y., Guo, X., Belmonte, F., Kang, B., Bedja, D., Pin, S., Tsuchiya, N., and Gabrielson, K. (2012). Cardiac-specific over-expression of epidermal growth factor receptor 2 (erbb2) induces pro-survival pathways and hypertrophic cardiomyopathy in mice. PLoS One 7, e42805.
Taketa, Y., Shiotani, M., Tsuru, Y., Kotani, S., Osada, Y., Fukushima, T., Inomata, A., and Hosokawa, S. (2015). Application of a compact magnetic resonance imaging system for toxicologic pathology: Evaluation of lithium-pilocarpine-induced rat brain lesions. J Toxicol Pathol 28, 217-24.
Takimoto, E., Champion, H. C., Li, M., Belardi, D., Ren, S., Rodriguez, E. R., Bedja, D., Gabrielson, K. L., Wang, Y., and Kass, D. A. (2005). Chronic inhibition of cyclic gmp phosphodiesterase 5a prevents and reverses cardiac hypertrophy. Nat Med 11, 214-22.
Taruttis, A., Morscher, S., Burton, N. C., Razansky, D., and Ntziachristos, V. (2012). Fast multispectral optoacoustic tomography (msot) for dynamic imaging of pharmacokinetics and biodistribution in multiple organs. PLoS One 7, e30491.
Tempel-Brami, C., Schiffenbauer, Y. S., Nyska, A., Ezov, N., Spector, I., Abramovitch, R., and Maronpot, R. R. (2015). Practical applications of in vivo and ex vivo mri in toxicologic pathology using a novel high-performance compact mri system. Toxicol Pathol 43, 633-50.
ter Weele, E. J., Terwisscha van Scheltinga, A. G., Kosterink, J. G., Pot, L., Vedelaar, S. R., Lamberts, L. E., Williams, S. P., Lub-de Hooge, M. N., and de Vries, E. G. (2015). Imaging the distribution of an antibody-drug conjugate constituent targeting mesothelin with (8)(9)zr and irdye 800cw in mice bearing human pancreatic tumor xenografts. Oncotarget 6, 42081-90.
Towle, E. L., Richards, L. M., Kazmi, S. M., Fox, D. J., and Dunn, A. K. (2012). Comparison of indocyanine green angiography and laser speckle contrast imaging for the assessment of vasculature perfusion. Neurosurgery 71, 1023-30; discussion 1030-1.
Vakoc, B. J., Lanning, R. M., Tyrrell, J. A., Padera, T. P., Bartlett, L. A., Stylianopoulos, T., Munn, L. L., Tearney, G. J., Fukumura, D., Jain, R. K., and Bouma, B. E. (2009). Three-dimensional microscopy of the tumor microenvironment in vivo using optical frequency domain imaging. Nature Medicine 15, 1219-23.
van Deel, E., Ridwan, Y., van Vliet, J. N., Belenkov, S., and Essers, J. (2016). In vivo quantitative assessment of myocardial structure, function, perfusion and viability using cardiac micro-computed tomography. J Vis Exp, 53603.
van der Have, F., Vastenhouw, B., Ramakers, R. M., Branderhorst, W., Krah, J. O., Ji, C., Staelens, S. G., and Beekman, F. J. (2009). U-spect-ii: An ultra-high-resolution device for molecular small-animal imaging. J Nucl Med 50, 599-605.
Vaquero, J. J., and Kinahan, P. (2015). Positron emission tomography: Current challenges and opportunities for technological advances in clinical and preclinical imaging systems. Annu Rev Biomed Eng 17, 385-414.
Vasquez, K., and Peterson, J. (2014). Pre-clinical in vivo imaging. Application note., https://www.perkinelmer.com/lab-solutions/resources/docs/APP_011715_01_DrugInducedLiverInjury.pdf
Vasquez, K. O., Casavant, C., and Peterson, J. D. (2011). Quantitative whole body biodistribution of fluorescent-labeled agents by non-invasive tomographic imaging. PLoS One 6, e20594.
Vasquez, K. O., and Peterson, J. D. (2014). Pre-clinical in vivo imaging. Application note., https://www.perkinelmer.com/lab-solutions/resources/docs/APP_011715_01_DrugInducedLiverInjury.pdf
Vasquez, S. X., Shah, N., and Hoberman, A. M. (2013). Small animal imaging and examination by micro-ct. Methods Mol Biol 947, 223-31.
Wang, Y., Yu, G., Gao, S., Lin, L., Chen, W., and Zhu, Y. (2016). Applications of micro-ct in imaging heart diseases of the murine models. Austin Journal of Nuclear Medicine and Radiotherapy 3, 1017 (1-6).
Wenzel, A. A., O’Hare, M. N., Shadmand, M., and Corson, T. W. (2015). Optical coherence tomography enables imaging of tumor initiation in the tag-rb mouse model of retinoblastoma. Mol Vis 21, 515-22.
Wise, L. D., Xue, D., and Winkelmann, C. T. (2010). Micro-computed tomographic evaluation of fetal skeletal changes induced by all-trans-retinoic acid in rats and rabbits. Birth Defects Res B Dev Reprod Toxicol 89, 408-17.
Yang, Y., Kimura-Ohba, S., Thompson, J., and Rosenberg, G. A. (2016). Rodent models of vascular cognitive impairment. Transl Stroke Res 7, 407-14.
Yao, R., Lecomte, R., and Crawford, E. S. (2012). Small-animal pet: What is it, and why do we need it? J Nucl Med Technol 40, 157-65.
Zhongchan, S., Hauang, P., Tong, G., Lin, J., Jin, A., Rong, P., Zhu, L., Nie, L., Niu, G., Cao, F., and Chen, X. (2013). Vegf-loaded graphene oxide as theranostics for multi-modality imaging-monitored targeting therapeutic angiogenesis of ischemic muscle. Nanoscale 5, 6857-6866.